<?xml version="1.0" encoding="utf-8"?><feed xmlns="http://www.w3.org/2005/Atom" ><generator uri="https://jekyllrb.com/" version="3.10.0">Jekyll</generator><link href="/feed.xml" rel="self" type="application/atom+xml" /><link href="/" rel="alternate" type="text/html" /><updated>2026-06-10T01:29:34+00:00</updated><id>/feed.xml</id><title type="html">Chris Douglas</title><subtitle>PhD Student at UC Berkeley</subtitle><author><name>Chris Douglas</name><email>chris_douglas@berkeley.edu</email><uri>https://cdouglas.github.io</uri></author><entry><title type="html">Simulating Multi-Table Contention in Catalog Formats</title><link href="/posts/2026/03/providercatalog" rel="alternate" type="text/html" title="Simulating Multi-Table Contention in Catalog Formats" /><published>2026-03-23T11:00:00+00:00</published><updated>2026-03-23T11:00:00+00:00</updated><id>/posts/2026/03/providercatalog</id><content type="html" xml:base="/posts/2026/03/providercatalog"><![CDATA[<h1 id="tldr">tl;dr</h1>

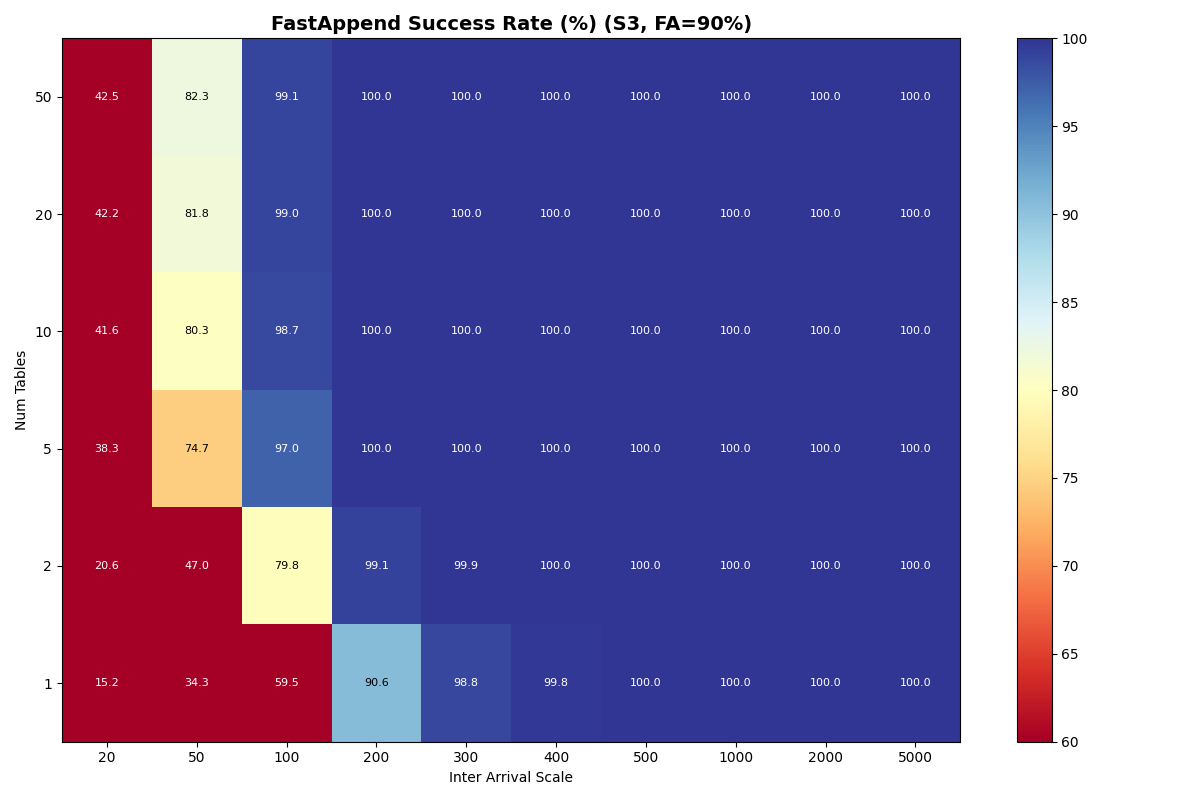
<p><a href="#correction-2026-06-09">Update: Corrected simulations 2026-06-09</a></p>

<p>[<a href="/posts/2026/01/conditional">Part 1</a>] [<a href="/posts/2026/03/catalog">Part 2</a>]</p>

<p>Table formats like Apache Iceberg were designed before conditional operations
were widely available in object stores. These operations are sufficient to
support Iceberg’s linearizable table update protocol, but how would they perform?
Simulating multi-table commit contention at the catalog suggests:</p>

<ol>
  <li>
    <p><strong>Partitions help throughput and VO tail latency.</strong> Distributing a uniform
workload across 20 tables roughly doubles aggregate throughput for slower
providers (1.5–2.5x) and compresses VO mean latency by 5–8x. With zipfian
skew, the most popular table converges to single-table performance, but
other tables are mostly unaffected by the hot table’s contention.</p>
  </li>
  <li>
    <p><strong>Provider choice is a larger lever than table count.</strong> S3 Express One Zone
(S3x) sustains 14.6 c/s on a single table- more per-table throughput than
spreading a workload across 50 tables on S3 Standard, even with an
“instant” catalog. The entire commit pipeline (CAS + manifest I/O)
compresses with faster storage; adding tables only helps with catalog
contention.</p>
  </li>
  <li>
    <p><strong>Longer-tailed distributions compound under contention.</strong> Each attempt
requires multiple reads/writes in the object store. Variability extends the
hazard window and makes workloads less stable overall. For example, S3 and
Azure Premium have similar median CAS latency (61, 64ms), but Azure Standard’s
longer tails result in more failures as it approaches saturation.</p>
  </li>
  <li>
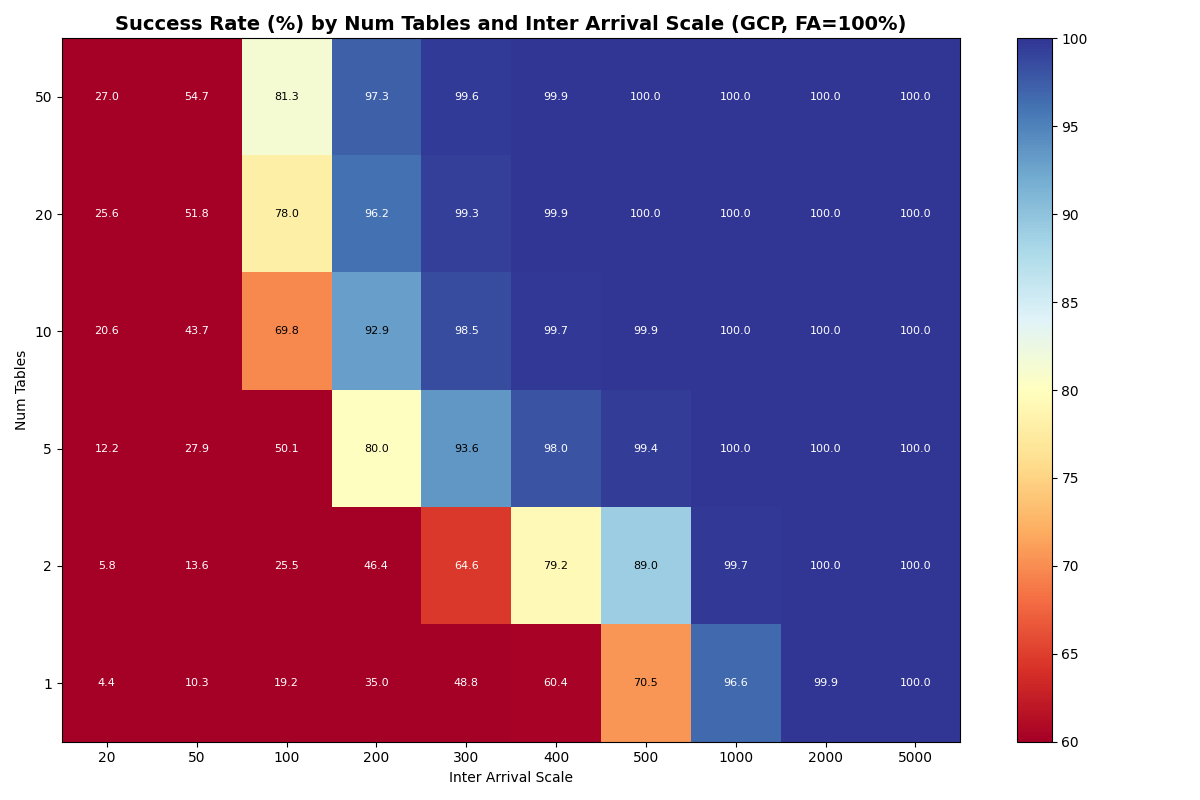
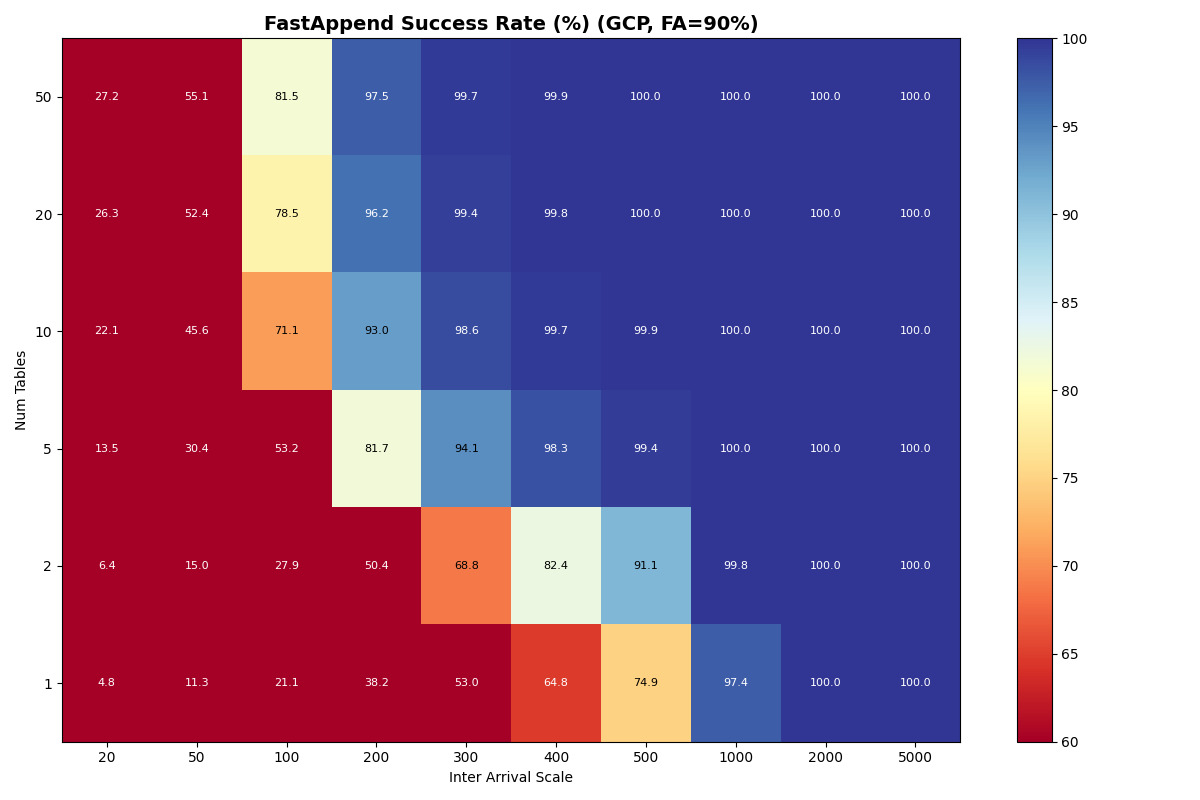
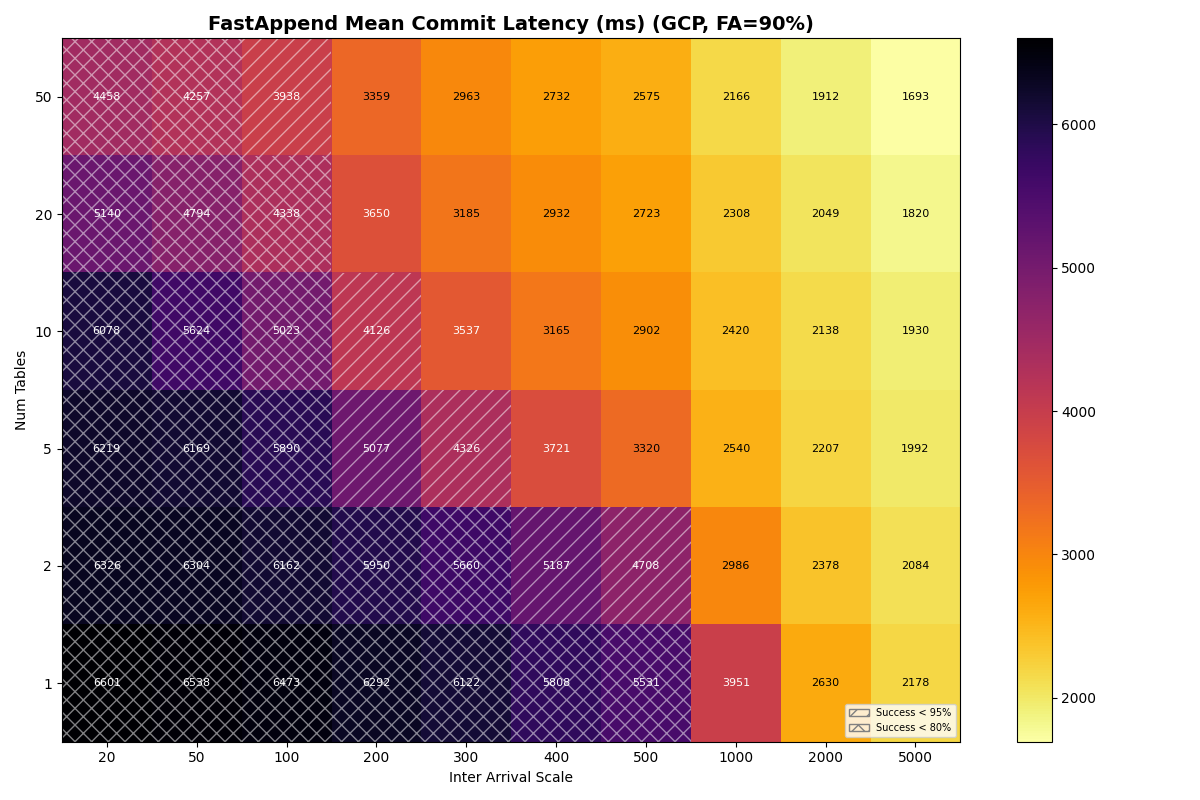
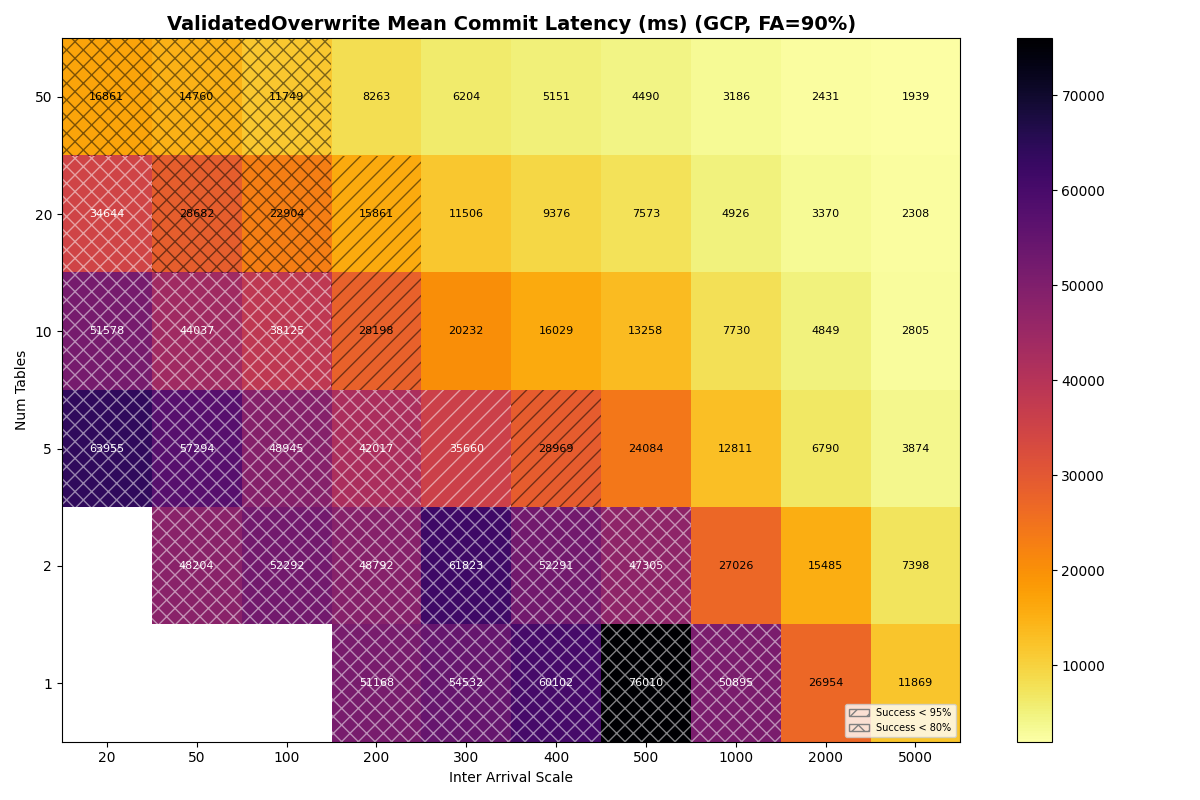
    <p><strong>GCS is not viable for catalog-as-file workloads.</strong> This follows from
<a href="/posts/2026/01/conditional">raw</a> GCS CAS latency. Commit success degrades
above ~0.4 commits/sec, whether the workload is pure FastAppend or a 90/10
mix. Adding tables barely helps: the per-table I/O cost is high enough that
50 tables only lifts the usable rate to ~0.7 c/s.</p>
  </li>
</ol>

<figure class="center ">


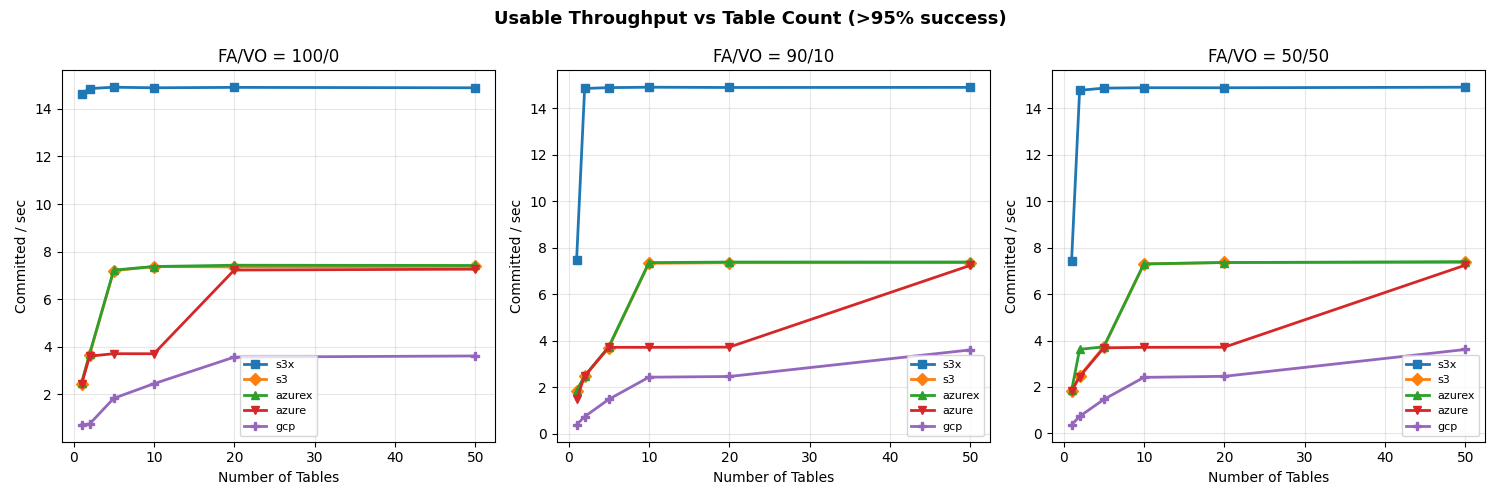
    <a href="/images/2026/03/providercatalog/exp4c_tables_providers/workload_knee/workload_knee_vs_tables.png" class="glightbox" data-gallery="exp4c_single_table_usable-simulated-provider-performance-distributed-over-1-to-50-tables-uniform-these-rates-are-20-50-of-measured-cas-saturation-for-these-providers-due-to-commit-protocol-overhead" data-description="Usable throughput (&gt;95% success) vs table count for all providers at FA/VO ratios of 100/0, 90/10, and 50/50. S3x sustains 14.9 c/s through 10 tables and jumps to ~36 c/s FA-only at 20+ tables (14.9 c/s for mixed workloads). S3, Azure Premium, and Azure Standard plateau at 3.7 c/s by 5 tables; S3 FA-only breaks out to 7.2 c/s at 50 tables. GCP climbs from 0.4 c/s (1 table) to 0.7 c/s at 5+ tables and flattens. Adding VO transactions drops single-table throughput for all providers but is recovered with 2+ tables for S3x and 5+ tables for others.">
      <img src="/images/2026/03/providercatalog/exp4c_tables_providers/workload_knee/workload_knee_vs_tables.png" alt="Usable throughput (&gt;95% success) vs table count for all providers at FA/VO ratios of 100/0, 90/10, and 50/50. S3x sustains 14.9 c/s through 10 tables and jumps to ~36 c/s FA-only at 20+ tables (14.9 c/s for mixed workloads). S3, Azure Premium, and Azure Standard plateau at 3.7 c/s by 5 tables; S3 FA-only breaks out to 7.2 c/s at 50 tables. GCP climbs from 0.4 c/s (1 table) to 0.7 c/s at 5+ tables and flattens. Adding VO transactions drops single-table throughput for all providers but is recovered with 2+ tables for S3x and 5+ tables for others." />
    </a>


    <figcaption>Simulated provider performance distributed over 1 to 50 tables (uniform). These rates are 20-50% of measured CAS saturation for these providers, due to commit protocol overhead.
</figcaption>
  
</figure>

<p>The commit protocol bottleneck is well-known among table format developers;
lifting it <a href="https://ducklake.select/">whole</a> or <a href="https://polaris.apache.org/">in
part</a> into a dedicated service is a popular
solution. Now that we’ve measured and characterized the protocol, we can explore
those tradeoffs in a later post.</p>

<h1 id="commit-contention-in-catalog-files">Commit Contention in Catalog Files</h1>

<p><a href="/posts/2026/03/catalog">Previously</a> we simulated single-table commit rates. Now
we add another dimension: multiple tables in the catalog. These are not
multi-table transactions, but rather independent table updates that <em>physically</em>
conflict at the catalog. For example, if transactions T1 and T2 update tables A
and B respectively, T1 successfully updating the catalog reference for A could cause
T2 to fail its commit to B. However, repairing T2’s commit is cheaper than what
we measured last time: T2 only needs to retry at the catalog, <em>not</em> rewrite the
table metadata or its manifest list.</p>

<p>This models the “catalog as file” case where the entire catalog is conditionally
replaced on every commit. Note that as the number of tables increases, the
inter-arrival time is distributed across <em>all the tables in the catalog</em>; be
careful <em>not</em> to read it as the arrival rate for a single table, which we
measured before.</p>

<h1 id="experiment-summary">Experiment Summary</h1>

<p>The workload mix is the <a href="/posts/2026/03/catalog#workload-mix">same</a> as in the
single-table experiments, composed of “light” FastAppend (FA) and “heavy”
validated overwrite (VO) transactions. The salient difference between FA and VO
is the I/O necessary to retry a transaction: a FA transaction
needs to re-read only the latest manifest list while a VO transaction needs to
read the manifest lists of all new snapshots of that table.</p>

<p>The workload is steady, but optimistic: it assumes no transaction needs to read
beyond the manifest list to investigate or repair a conflict before retrying.
Real workloads include commit attempts that do more work between attempts,
increasing the chance of conflict.</p>

<p>Tables are selected from either uniform or Zipfian distributions, as annotated.</p>

<table>
  <thead>
    <tr>
      <th>Exp</th>
      <th>Description</th>
      <th>Fixed</th>
      <th>Swept</th>
      <th>Configs</th>
    </tr>
  </thead>
  <tbody>
    <tr>
      <td><strong>4a</strong></td>
      <td><a href="#multi-table">Multi-table contention (FA)</a></td>
      <td>1 group, FA=100%, S3, conflicts=0%</td>
      <td><code class="language-plaintext highlighter-rouge">num_tables</code><br /><code class="language-plaintext highlighter-rouge">catalog_latency_ms</code><br /><code class="language-plaintext highlighter-rouge">inter_arrival_scale</code></td>
      <td>240</td>
    </tr>
    <tr>
      <td><strong>4b</strong></td>
      <td><a href="#multi-table">Multi-table contention (mix)</a></td>
      <td>1 group, FA=90%/VO=10%, S3, conflicts=0%</td>
      <td><code class="language-plaintext highlighter-rouge">num_tables</code><br /><code class="language-plaintext highlighter-rouge">catalog_latency_ms</code><br /><code class="language-plaintext highlighter-rouge">inter_arrival_scale</code></td>
      <td>240</td>
    </tr>
    <tr>
      <td><strong>4c</strong></td>
      <td><a href="#exp4c">Multi-table, real providers</a></td>
      <td>1 group, conflicts=0%, backend=storage</td>
      <td><code class="language-plaintext highlighter-rouge">provider</code><br /><code class="language-plaintext highlighter-rouge">num_tables</code><br /><code class="language-plaintext highlighter-rouge">fast_append_ratio</code><br /><code class="language-plaintext highlighter-rouge">inter_arrival_scale</code></td>
      <td>900</td>
    </tr>
  </tbody>
</table>

<table>
  <thead>
    <tr>
      <th>Parameter</th>
      <th>Values</th>
      <th>Description</th>
    </tr>
  </thead>
  <tbody>
    <tr>
      <td><code class="language-plaintext highlighter-rouge">inter_arrival_scale</code></td>
      <td>[20, 50, 100, 200, 300, 400, 500, 1000, 2000, 5000] ms</td>
      <td>Scale parameter for the exponential distribution of transaction inter-arrival times. Lower values correspond to higher transaction rates.</td>
    </tr>
    <tr>
      <td><code class="language-plaintext highlighter-rouge">fast_append_ratio</code></td>
      <td>[1.0, 0.9, 0.8, 0.7, 0.5, 0.3, 0.1, 0.0]</td>
      <td>Ratio of FastAppend (light) transactions to ValidatedOverwrite (heavy) transactions in the workload mix. 1.0 means all transactions are FastAppend, while 0.0 means all transactions are ValidatedOverwrite.</td>
    </tr>
    <tr>
      <td><code class="language-plaintext highlighter-rouge">catalog_latency_ms</code></td>
      <td>[ 1, 10, 50, 120]</td>
      <td>Latency of the catalog’s compare-and-set (CAS) operation in milliseconds. This models the time it takes for a transaction to attempt a commit and receive a response from the catalog.</td>
    </tr>
    <tr>
      <td><code class="language-plaintext highlighter-rouge">num_tables</code></td>
      <td>[1, 2, 5, 10, 20, 50]</td>
      <td>Number of tables in the catalog. This models the contention at the catalog when multiple tables are being updated concurrently.</td>
    </tr>
    <tr>
      <td><code class="language-plaintext highlighter-rouge">provider</code></td>
      <td>[s3x, s3, azurex, azure, gcp]</td>
      <td>Cloud storage provider used for the catalog. Each provider has different CAS latency distributions, which affect the commit success rates and latencies.</td>
    </tr>
  </tbody>
</table>

<p>In all experiments, the manifest list and table metadata sizes are fixed (10KiB
and 100KiB, respectively). Manifest and metadata I/O uses unconditional <code class="language-plaintext highlighter-rouge">GET</code>
and <code class="language-plaintext highlighter-rouge">PUT</code> operations, not the conditional operations measured earlier. We use the same
S3 Standard latencies for experiments <a href="#multi-table">4a/4b</a> as we used
in the single-table experiments. We use provider distributions for experiment
<a href="#exp4c">4c</a> (i.e., unconditional reads/writes for metadata, conditional writes
for the catalog).</p>

<details>
  <summary>Latency distributions for S3 Standard (click to expand)</summary>

  <h2 id="distribution-parameters">Distribution Parameters</h2>

  <h3 id="get-unconditional-read">GET (unconditional read)</h3>

  <p>Modeled as <code class="language-plaintext highlighter-rouge">Lognormal(mu=ln(median), sigma)</code>, floored at <code class="language-plaintext highlighter-rouge">min_latency_ms</code>.</p>

  <table>
    <thead>
      <tr>
        <th>Operation</th>
        <th style="text-align: right">median (ms)</th>
        <th style="text-align: right">sigma</th>
        <th style="text-align: right">min_latency (ms)</th>
      </tr>
    </thead>
    <tbody>
      <tr>
        <td>GET</td>
        <td style="text-align: right">27</td>
        <td style="text-align: right">0.62</td>
        <td style="text-align: right">10</td>
      </tr>
    </tbody>
  </table>

  <p><code class="language-plaintext highlighter-rouge">GET</code> operations don’t include sizes because latency is dominated by fixed
overheads at these sizes.</p>

  <h3 id="put-unconditional-write">PUT (unconditional write)</h3>

  <p>Modeled as <code class="language-plaintext highlighter-rouge">Lognormal(mu=ln(base + rate * size_MiB), sigma)</code>, floored at <code class="language-plaintext highlighter-rouge">min_latency_ms</code>.</p>

  <table>
    <thead>
      <tr>
        <th>Operation</th>
        <th style="text-align: right">base (ms)</th>
        <th style="text-align: right">rate (ms/MiB)</th>
        <th style="text-align: right">sigma</th>
        <th style="text-align: right">min_latency (ms)</th>
      </tr>
    </thead>
    <tbody>
      <tr>
        <td>PUT</td>
        <td style="text-align: right">60</td>
        <td style="text-align: right">20</td>
        <td style="text-align: right">0.29</td>
        <td style="text-align: right">10</td>
      </tr>
    </tbody>
  </table>

  <h2 id="percentiles">Percentiles</h2>

  <table>
    <thead>
      <tr>
        <th>Operation</th>
        <th style="text-align: right">p5</th>
        <th style="text-align: right">p10</th>
        <th style="text-align: right">p25</th>
        <th style="text-align: right">p50</th>
        <th style="text-align: right">p75</th>
        <th style="text-align: right">p90</th>
        <th style="text-align: right">p95</th>
        <th style="text-align: right">p99</th>
      </tr>
    </thead>
    <tbody>
      <tr>
        <td>GET</td>
        <td style="text-align: right">10</td>
        <td style="text-align: right">12</td>
        <td style="text-align: right">18</td>
        <td style="text-align: right">27</td>
        <td style="text-align: right">41</td>
        <td style="text-align: right">60</td>
        <td style="text-align: right">75</td>
        <td style="text-align: right">114</td>
      </tr>
      <tr>
        <td>PUT</td>
        <td style="text-align: right">37</td>
        <td style="text-align: right">42</td>
        <td style="text-align: right">50</td>
        <td style="text-align: right">60</td>
        <td style="text-align: right">73</td>
        <td style="text-align: right">87</td>
        <td style="text-align: right">97</td>
        <td style="text-align: right">118</td>
      </tr>
    </tbody>
  </table>

</details>

<h2 id="multi-table-scaling-4a-4b">Multi-table scaling (4a, 4b)</h2>
<p><a id="multi-table"></a></p>

<p>Before measuring real providers, we sweep the number of tables (1-50) and
catalog CAS latency (1-120ms) to establish how much multi-table scaling can buy.
Experiments 4a (FA-only) and 4b (90/10 FA/VO) use simulated S3 Standard
latencies for manifest I/O, with synthetic CAS latencies. Full heatmaps are in
<a href="#appendix-a">Appendix A</a>.</p>

<h3 id="uniform-distribution-tables-move-the-bottleneck-to-the-catalog">Uniform distribution: tables move the bottleneck to the catalog</h3>
<p><a id="exp4a"></a></p>

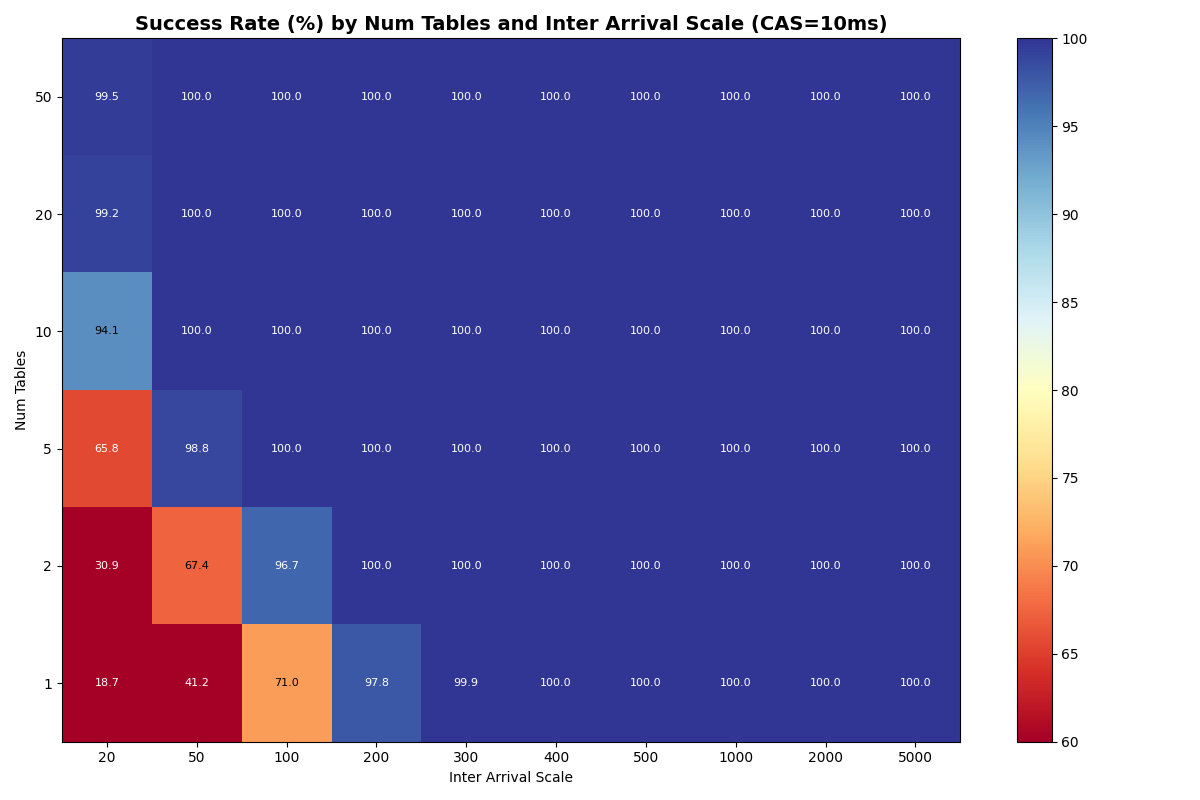
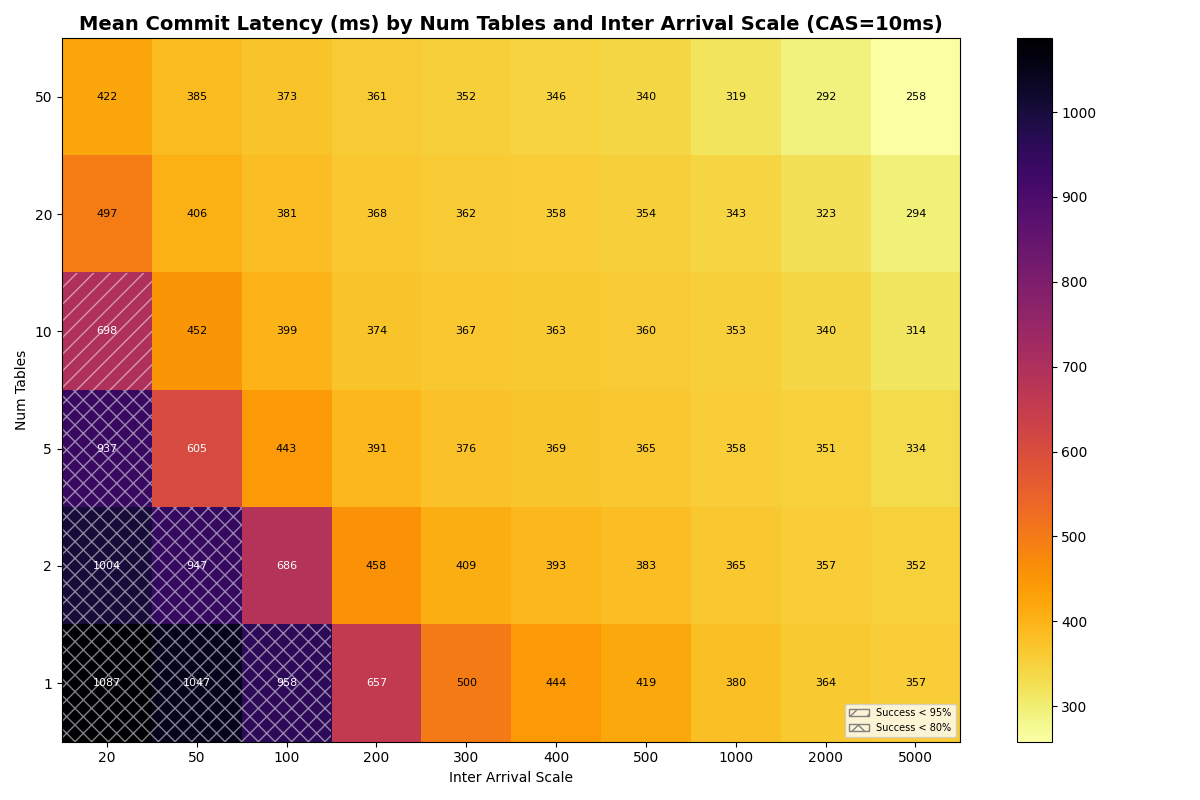
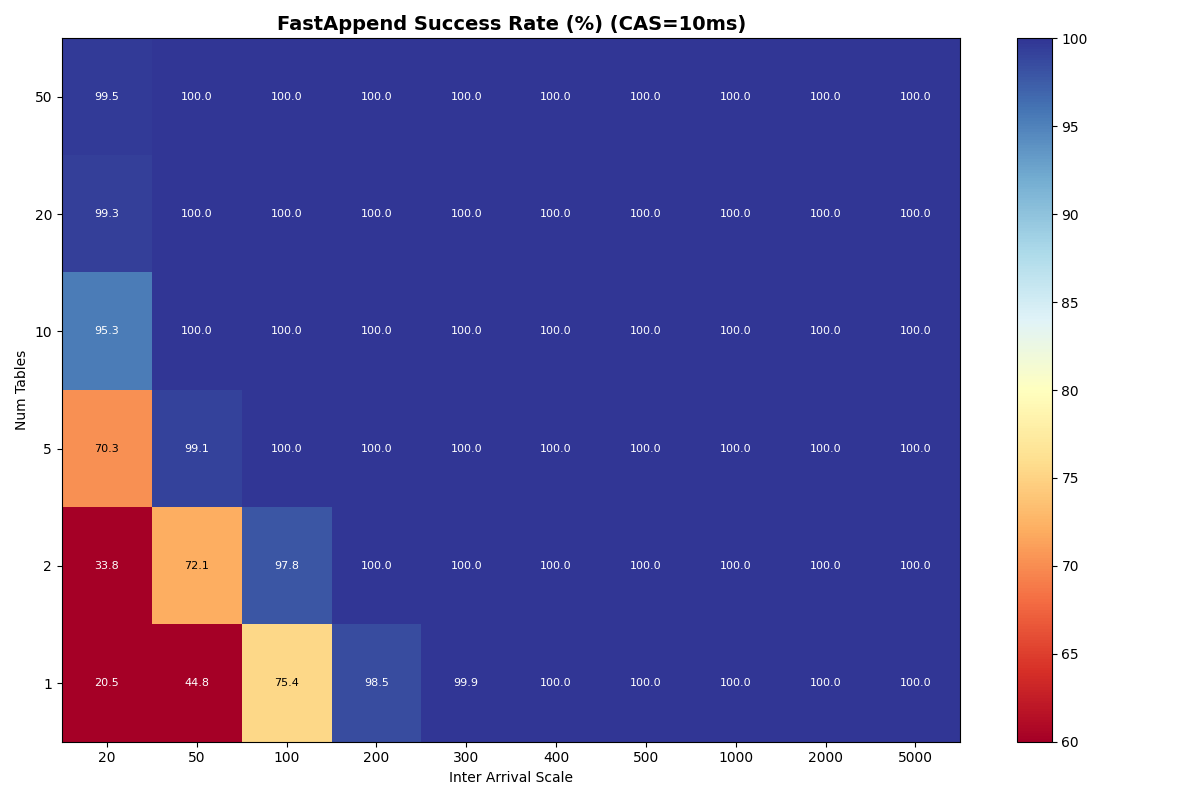
<p>With a fast catalog (1-10ms CAS), distributing FA transactions uniformly across
more tables lifts success rates at high load, though the 20ms×50-tables corner
is no longer a free lunch: 50 tables at 20ms inter-arrival reach 88% success
at 1ms CAS, 70% at 10ms CAS. At 100ms+ inter-arrival (≤10 c/s offered), 10+
tables hit 100% success at CAS latencies up to 10ms.</p>

<figure class="half ">


    <a href="/images/2026/03/providercatalog/exp4a_tables_fa/cas_10ms/heatmap_success_rate.png" class="glightbox" data-gallery="exp4a_tables_fa_10ms-exp-4a-fa-success-rate-and-latency-by-table-count-and-inter-arrival-time-10ms-1ms-cas-more-tables-shift-the-bottleneck-from-per-table-metadata-i-o-to-the-catalog" data-description="Exp 4a: Heatmap of FA success rate by number of tables (1-50) and inter-arrival scale, 10ms CAS. More tables dramatically improve success: 50 tables achieve 69.5% at 20ms inter-arrival vs 13.9% with 1 table. 10+ tables reach 100% at 100ms+ inter-arrival.">
      <img src="/images/2026/03/providercatalog/exp4a_tables_fa/cas_10ms/heatmap_success_rate.png" alt="Exp 4a: Heatmap of FA success rate by number of tables (1-50) and inter-arrival scale, 10ms CAS. More tables dramatically improve success: 50 tables achieve 69.5% at 20ms inter-arrival vs 13.9% with 1 table. 10+ tables reach 100% at 100ms+ inter-arrival." />
    </a>


    <a href="/images/2026/03/providercatalog/exp4a_tables_fa/cas_10ms/xheatmap_mean_latency.png" class="glightbox" data-gallery="exp4a_tables_fa_10ms-exp-4a-fa-success-rate-and-latency-by-table-count-and-inter-arrival-time-10ms-1ms-cas-more-tables-shift-the-bottleneck-from-per-table-metadata-i-o-to-the-catalog" data-description="Exp 4a: Heatmap of mean commit latency by table count and inter-arrival scale, 10ms CAS. Latency drops with more tables: 50 tables at 20ms is 701ms vs 1443ms for 1 table. Baseline converges to 338-455ms at 5000ms inter-arrival. Hatched cells indicate low success rates.">
      <img src="/images/2026/03/providercatalog/exp4a_tables_fa/cas_10ms/xheatmap_mean_latency.png" alt="Exp 4a: Heatmap of mean commit latency by table count and inter-arrival scale, 10ms CAS. Latency drops with more tables: 50 tables at 20ms is 701ms vs 1443ms for 1 table. Baseline converges to 338-455ms at 5000ms inter-arrival. Hatched cells indicate low success rates." />
    </a>


    <a href="/images/2026/03/providercatalog/exp4a_tables_fa/cas_10ms/xheatmap_p99_latency.png" class="glightbox" data-gallery="exp4a_tables_fa_10ms-exp-4a-fa-success-rate-and-latency-by-table-count-and-inter-arrival-time-10ms-1ms-cas-more-tables-shift-the-bottleneck-from-per-table-metadata-i-o-to-the-catalog" data-description="Exp 4a: Heatmap of p99 commit latency by table count and inter-arrival scale, 10ms CAS. 1 table at 20ms reaches 2767ms; 50 tables at 20ms is 1279ms. At low load (5000ms), p99 ranges 593-744ms. Hatched cells in bottom-left indicate low success rates." style="display:none">
    </a>


    <a href="/images/2026/03/providercatalog/exp4a_tables_fa/cas_1ms/heatmap_success_rate.png" class="glightbox" data-gallery="exp4a_tables_fa_10ms-exp-4a-fa-success-rate-and-latency-by-table-count-and-inter-arrival-time-10ms-1ms-cas-more-tables-shift-the-bottleneck-from-per-table-metadata-i-o-to-the-catalog" data-description="Exp 4a: FA success rate by table count and inter-arrival, 1ms CAS. Similar pattern to 10ms but shifted: 10 tables at 20ms reaches 77.1% (vs 63.5% at 10ms). 20+ tables reach 100% at 100ms. 1 table at 20ms is 14.7%, at 50ms is 33.1%." style="display:none">
    </a>


    <a href="/images/2026/03/providercatalog/exp4a_tables_fa/cas_1ms/xheatmap_mean_latency.png" class="glightbox" data-gallery="exp4a_tables_fa_10ms-exp-4a-fa-success-rate-and-latency-by-table-count-and-inter-arrival-time-10ms-1ms-cas-more-tables-shift-the-bottleneck-from-per-table-metadata-i-o-to-the-catalog" data-description="Exp 4a: Mean commit latency by table count and inter-arrival, 1ms CAS. 1 table at 20ms is 1347ms, 50 tables at 20ms is 588ms. At 5000ms, 1 table converges to 425ms, 50 tables to 308ms. Lowest latencies of all CAS settings." style="display:none">
    </a>


    <a href="/images/2026/03/providercatalog/exp4a_tables_fa/cas_1ms/xheatmap_p99_latency.png" class="glightbox" data-gallery="exp4a_tables_fa_10ms-exp-4a-fa-success-rate-and-latency-by-table-count-and-inter-arrival-time-10ms-1ms-cas-more-tables-shift-the-bottleneck-from-per-table-metadata-i-o-to-the-catalog" data-description="Exp 4a: P99 commit latency by table count and inter-arrival, 1ms CAS. 1 table at 20ms is 2585ms, 50 tables at 20ms is 1143ms. At 5000ms, p99 ranges 564-699ms. Much tighter tails than higher CAS latencies." style="display:none">
    </a>


    <figcaption>Exp 4a: FA success rate and latency by table count and inter-arrival time (10ms, 1ms CAS). More tables shift the bottleneck from per-table metadata I/O to the catalog.
</figcaption>
  
</figure>

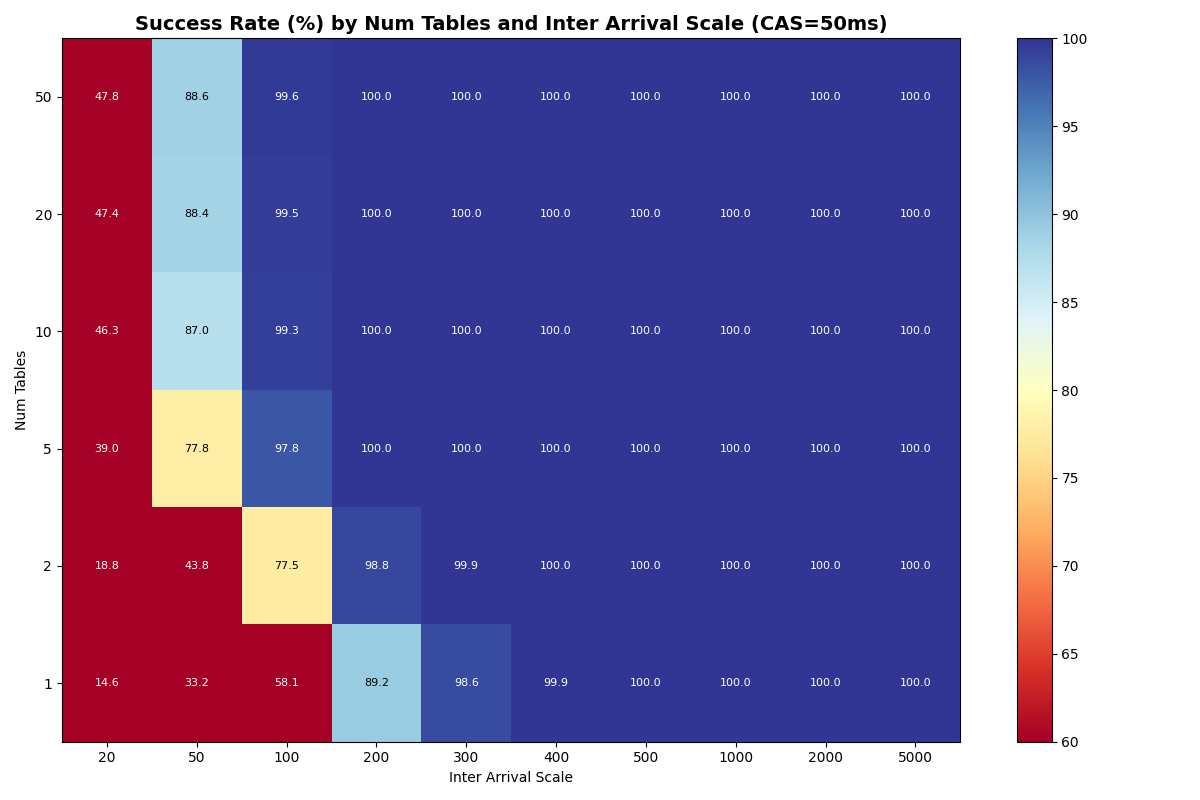
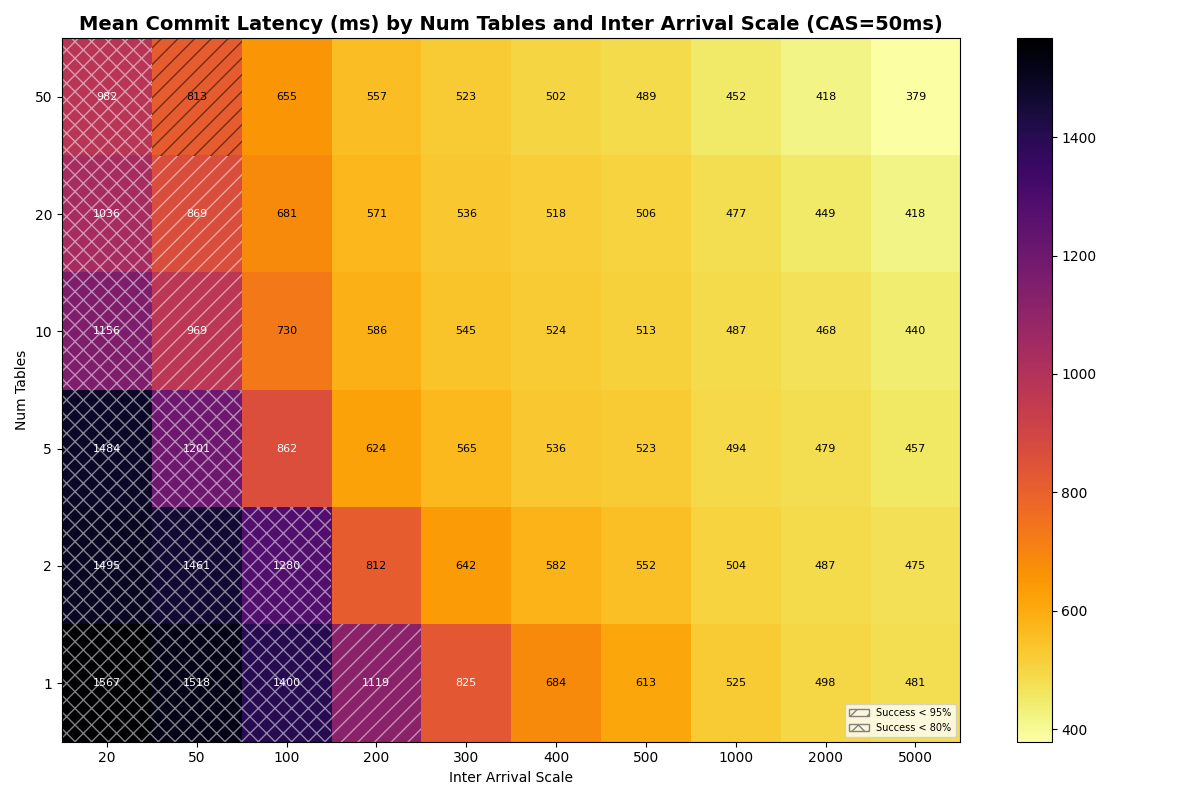
<p>At CAS latencies closer to real providers (50-120ms), the frontier tightens. At
50ms CAS, the knee (&gt;95% success rate) sits near ~10 c/s with 20+ tables. At
120ms CAS, the knee drops to ~5 c/s- the catalog round-trip dominates retry
cost at every table count.</p>

<figure class="half ">


    <a href="/images/2026/03/providercatalog/exp4a_tables_fa/cas_50ms/heatmap_success_rate.png" class="glightbox" data-gallery="exp4a_tables_fa_50ms-exp-4a-fa-success-rate-and-latency-by-table-count-50ms-120ms-cas-at-realistic-cas-latencies-table-count-provides-less-relief" data-description="Exp 4a: Heatmap of FA success rate by table count and inter-arrival scale, 50ms CAS. Worse than 10ms: 1 table at 20ms is 11.5%, 50 tables at 20ms is only 35.1%. Even 20-50 tables need 200ms+ inter-arrival for 99%+ success.">
      <img src="/images/2026/03/providercatalog/exp4a_tables_fa/cas_50ms/heatmap_success_rate.png" alt="Exp 4a: Heatmap of FA success rate by table count and inter-arrival scale, 50ms CAS. Worse than 10ms: 1 table at 20ms is 11.5%, 50 tables at 20ms is only 35.1%. Even 20-50 tables need 200ms+ inter-arrival for 99%+ success." />
    </a>


    <a href="/images/2026/03/providercatalog/exp4a_tables_fa/cas_50ms/xheatmap_mean_latency.png" class="glightbox" data-gallery="exp4a_tables_fa_50ms-exp-4a-fa-success-rate-and-latency-by-table-count-50ms-120ms-cas-at-realistic-cas-latencies-table-count-provides-less-relief" data-description="Exp 4a: Heatmap of mean commit latency by table count and inter-arrival scale, 50ms CAS. Higher baseline than 10ms: 1 table at 5000ms is 578ms vs 455ms. At 20ms, 1 table reaches 1935ms and 50 tables 1218ms. Nearly all low-arrival cells are hatched.">
      <img src="/images/2026/03/providercatalog/exp4a_tables_fa/cas_50ms/xheatmap_mean_latency.png" alt="Exp 4a: Heatmap of mean commit latency by table count and inter-arrival scale, 50ms CAS. Higher baseline than 10ms: 1 table at 5000ms is 578ms vs 455ms. At 20ms, 1 table reaches 1935ms and 50 tables 1218ms. Nearly all low-arrival cells are hatched." />
    </a>


    <a href="/images/2026/03/providercatalog/exp4a_tables_fa/cas_50ms/xheatmap_p99_latency.png" class="glightbox" data-gallery="exp4a_tables_fa_50ms-exp-4a-fa-success-rate-and-latency-by-table-count-50ms-120ms-cas-at-realistic-cas-latencies-table-count-provides-less-relief" data-description="Exp 4a: Heatmap of p99 commit latency by table count and inter-arrival scale, 50ms CAS. 1 table at 20ms reaches 3603ms; 50 tables at 20ms is 2049ms. At low load (5000ms), p99 ranges 718-937ms. Wide hatched region covers most of the left half." style="display:none">
    </a>


    <a href="/images/2026/03/providercatalog/exp4a_tables_fa/cas_120ms/heatmap_success_rate.png" class="glightbox" data-gallery="exp4a_tables_fa_50ms-exp-4a-fa-success-rate-and-latency-by-table-count-50ms-120ms-cas-at-realistic-cas-latencies-table-count-provides-less-relief" data-description="Exp 4a: Heatmap of FA success rate by table count and inter-arrival scale, 120ms CAS. Severely degraded: even 50 tables at 20ms is only 18.1%. 1 table needs 500ms+ for 98%+ success. Table count provides less relief when CAS is the bottleneck." style="display:none">
    </a>


    <a href="/images/2026/03/providercatalog/exp4a_tables_fa/cas_120ms/xheatmap_mean_latency.png" class="glightbox" data-gallery="exp4a_tables_fa_50ms-exp-4a-fa-success-rate-and-latency-by-table-count-50ms-120ms-cas-at-realistic-cas-latencies-table-count-provides-less-relief" data-description="Exp 4a: Heatmap of mean commit latency by table count and inter-arrival scale, 120ms CAS. Very high latencies: 1 table at 20ms is 2757ms, 50 tables at 20ms is 2129ms. Even at 5000ms, baseline is 676-802ms. Nearly all cells are hatched." style="display:none">
    </a>


    <a href="/images/2026/03/providercatalog/exp4a_tables_fa/cas_120ms/xheatmap_p99_latency.png" class="glightbox" data-gallery="exp4a_tables_fa_50ms-exp-4a-fa-success-rate-and-latency-by-table-count-50ms-120ms-cas-at-realistic-cas-latencies-table-count-provides-less-relief" data-description="Exp 4a: Heatmap of p99 commit latency by table count and inter-arrival scale, 120ms CAS. Extreme tail latency: 1 table at 20ms reaches 5076ms, 50 tables at 20ms is 3483ms. At 5000ms, p99 is still 1085-1336ms. Nearly all cells are hatched." style="display:none">
    </a>


    <figcaption>Exp 4a: FA success rate and latency by table count (50ms, 120ms CAS). At realistic CAS latencies, table count provides less relief.
</figcaption>
  
</figure>

<h3 id="adding-vo-table-partitioning-reduces-per-table-retry-cost">Adding VO: table partitioning reduces per-table retry cost</h3>
<p><a id="exp4b"></a></p>

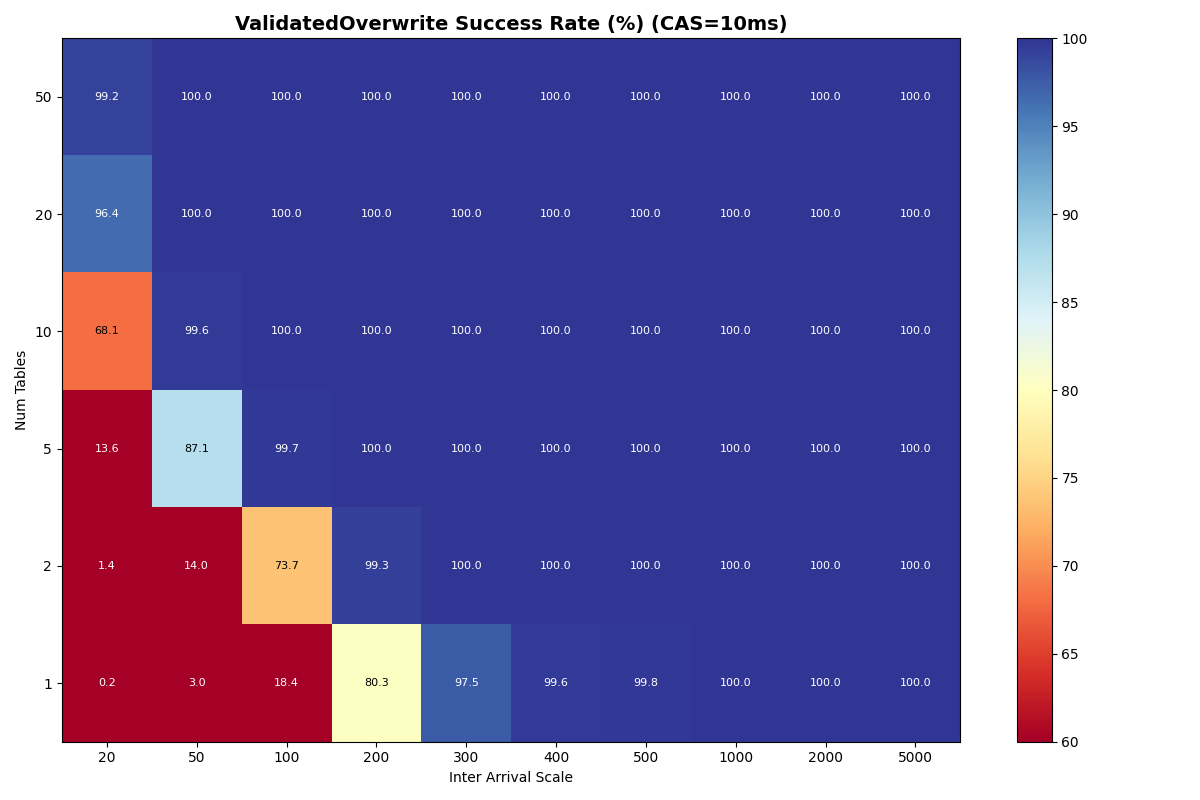
<p>Adding 10% VO transactions barely changes FA success rates. VO success improves
dramatically with table count. Each VO retry reads a manifest list for each
snapshot committed to that table since the read snapshot; with more tables, each
table sees fewer commits, reducing the per-table retry cost. At 10ms CAS with 50
tables, VO approaches FA success rates above 100ms inter-arrival; at 50ms CAS,
VO and FA success rates converge above 10 tables for moderate loads. At 120ms
CAS, the catalog limits both FA and VO equally.</p>

<figure class="half ">


    <a href="/images/2026/03/providercatalog/exp4b_tables_mix/cas_10ms/heatmap_fa_success_rate.png" class="glightbox" data-gallery="exp4b_tables_mix_per_tbl_retry-exp-4b-fa-and-vo-success-rates-and-vo-latency-90-10-mix-10ms-and-120ms-cas-fa-success-is-nearly-identical-to-4a-vo-success-improves-dramatically-with-table-count" data-description="Exp 4b: Heatmap of FA success rate (90/10 FA/VO mix) by table count and inter-arrival scale, 10ms CAS. Similar to exp4a FA-only: 50 tables at 20ms is 69.4%, 1 table at 20ms is 13.8%. VO presence barely affects FA success.">
      <img src="/images/2026/03/providercatalog/exp4b_tables_mix/cas_10ms/heatmap_fa_success_rate.png" alt="Exp 4b: Heatmap of FA success rate (90/10 FA/VO mix) by table count and inter-arrival scale, 10ms CAS. Similar to exp4a FA-only: 50 tables at 20ms is 69.4%, 1 table at 20ms is 13.8%. VO presence barely affects FA success." />
    </a>


    <a href="/images/2026/03/providercatalog/exp4b_tables_mix/cas_10ms/heatmap_vo_success_rate.png" class="glightbox" data-gallery="exp4b_tables_mix_per_tbl_retry-exp-4b-fa-and-vo-success-rates-and-vo-latency-90-10-mix-10ms-and-120ms-cas-fa-success-is-nearly-identical-to-4a-vo-success-improves-dramatically-with-table-count" data-description="Exp 4b: Heatmap of VO success rate (90/10 FA/VO mix) by table count and inter-arrival scale, 10ms CAS. VO benefits from table partitioning: 1 table at 20ms is near-zero, 50 tables at 20ms tracks FA closely. 10 tables at 100ms reaches 99%+; more tables nearly eliminate the VO disadvantage. VO converges to FA success rates with enough tables.">
      <img src="/images/2026/03/providercatalog/exp4b_tables_mix/cas_10ms/heatmap_vo_success_rate.png" alt="Exp 4b: Heatmap of VO success rate (90/10 FA/VO mix) by table count and inter-arrival scale, 10ms CAS. VO benefits from table partitioning: 1 table at 20ms is near-zero, 50 tables at 20ms tracks FA closely. 10 tables at 100ms reaches 99%+; more tables nearly eliminate the VO disadvantage. VO converges to FA success rates with enough tables." />
    </a>


    <a href="/images/2026/03/providercatalog/exp4b_tables_mix/cas_10ms/xheatmap_vo_mean_latency.png" class="glightbox" data-gallery="exp4b_tables_mix_per_tbl_retry-exp-4b-fa-and-vo-success-rates-and-vo-latency-90-10-mix-10ms-and-120ms-cas-fa-success-is-nearly-identical-to-4a-vo-success-improves-dramatically-with-table-count" data-description="Exp 4b: VO mean commit latency (90/10 mix) by table count and inter-arrival, 10ms CAS. VO latency is higher than FA: 50 tables at 5000ms is ~341ms, 1 table at 20ms is ~2256ms. Hatched cells in the lower-left indicate low success rates." style="display:none">
    </a>


    <a href="/images/2026/03/providercatalog/exp4b_tables_mix/cas_120ms/heatmap_fa_success_rate.png" class="glightbox" data-gallery="exp4b_tables_mix_per_tbl_retry-exp-4b-fa-and-vo-success-rates-and-vo-latency-90-10-mix-10ms-and-120ms-cas-fa-success-is-nearly-identical-to-4a-vo-success-improves-dramatically-with-table-count" data-description="Exp 4b: Heatmap of FA success rate (90/10 mix) by table count and inter-arrival, 120ms CAS. Further degraded: 1 table at 100ms is 38.5%, 50 tables at 20ms is 18.1%. 50 tables reach 100% by 500ms inter-arrival." style="display:none">
    </a>


    <a href="/images/2026/03/providercatalog/exp4b_tables_mix/cas_120ms/heatmap_vo_success_rate.png" class="glightbox" data-gallery="exp4b_tables_mix_per_tbl_retry-exp-4b-fa-and-vo-success-rates-and-vo-latency-90-10-mix-10ms-and-120ms-cas-fa-success-is-nearly-identical-to-4a-vo-success-improves-dramatically-with-table-count" data-description="Exp 4b: Heatmap of VO success rate (90/10 mix) by table count and inter-arrival, 120ms CAS. 1 table at 100ms is ~38%, 200ms is ~66%. 50 tables at 100ms is ~73%, 50 tables at 20ms is ~18%. FA and VO converge at high table counts, both limited by CAS latency." style="display:none">
    </a>


    <a href="/images/2026/03/providercatalog/exp4b_tables_mix/cas_120ms/xheatmap_vo_mean_latency.png" class="glightbox" data-gallery="exp4b_tables_mix_per_tbl_retry-exp-4b-fa-and-vo-success-rates-and-vo-latency-90-10-mix-10ms-and-120ms-cas-fa-success-is-nearly-identical-to-4a-vo-success-improves-dramatically-with-table-count" data-description="Exp 4b: VO mean commit latency (90/10 mix) by table count and inter-arrival, 120ms CAS. Very high latencies: 1 table at 20ms is ~3218ms, 50 tables at 20ms is ~2258ms. At 5000ms inter-arrival, baseline ranges 677-952ms. Nearly all cells are hatched due to low success rates." style="display:none">
    </a>


    <figcaption>Exp 4b: FA and VO success rates and VO latency (90/10 mix, 10ms and 120ms CAS). FA success is nearly identical to 4a; VO success improves dramatically with table count.
</figcaption>
  
</figure>

<h3 id="zipfian-skew-the-most-popular-table-converges-to-single-table-performance">Zipfian Skew: the most popular table converges to single-table performance</h3>
<p><a id="exp4-zipf"></a></p>

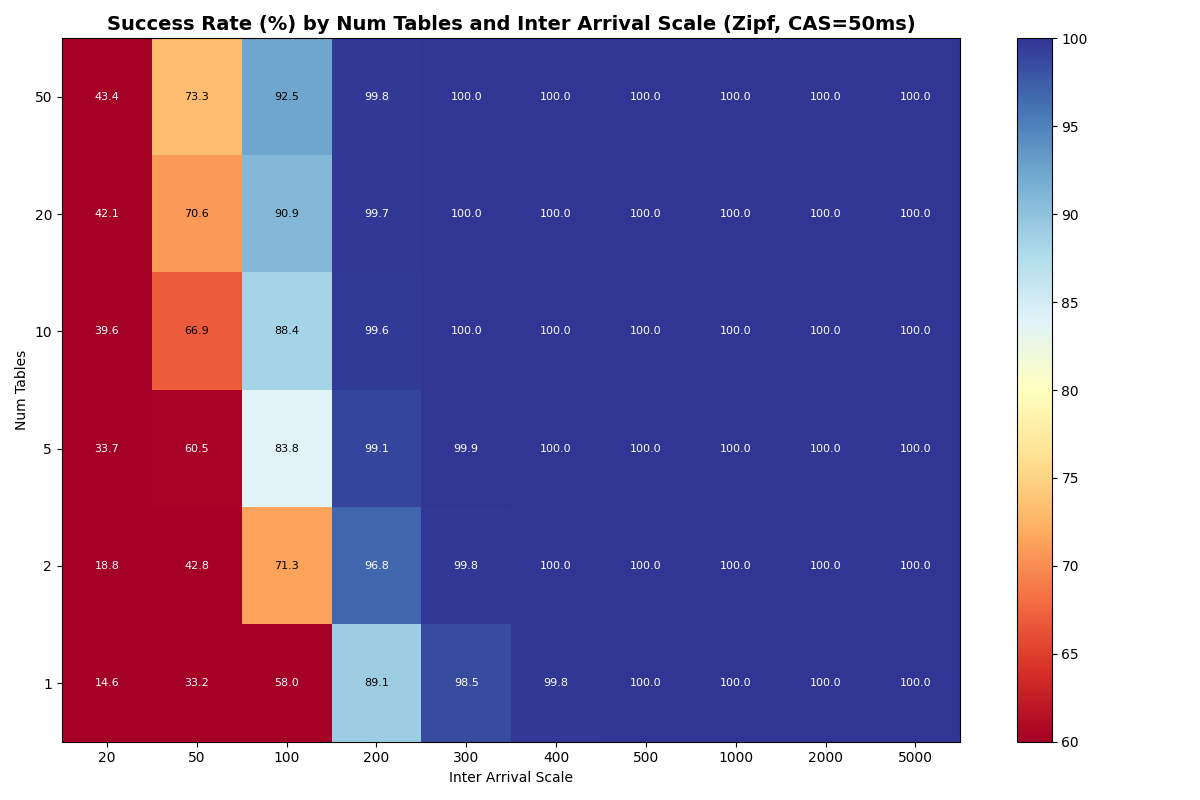
<p>Under a Zipfian (α = 1.5) distribution, the probability of selecting the
<em>k</em>th-ranked table is proportional to 1/<em>k</em><sup>1.5</sup>. The rank-1 table absorbs
~50% of writes regardless of how many tables exist; rank-2 gets ~18%, rank-3
~10%, and the distribution falls off steeply. The effective table count
tops out at ~4.5 even with 50 physical tables.</p>

<figure class="half ">


    <a href="/images/2026/03/providercatalog/exp4a_zipf_tables_fa/cas_50ms/heatmap_success_rate.png" class="glightbox" data-gallery="exp4a_tables_zipf_50ms-exp-4a-zipfian-table-selection-fa-only-50ms-cas-the-rank-1-table-dominates-collapsing-the-benefit-of-additional-tables" data-description="Exp 4a: Zipfian FA success rate by table count and inter-arrival, 50ms CAS. Much worse than uniform: 50 tables at 20ms is only 32.3% (vs 35.1% uniform). 10 tables at 100ms is 78.9%. Adding tables beyond 10 barely helps- Zipf 50 tables approximates uniform 5 tables.">
      <img src="/images/2026/03/providercatalog/exp4a_zipf_tables_fa/cas_50ms/heatmap_success_rate.png" alt="Exp 4a: Zipfian FA success rate by table count and inter-arrival, 50ms CAS. Much worse than uniform: 50 tables at 20ms is only 32.3% (vs 35.1% uniform). 10 tables at 100ms is 78.9%. Adding tables beyond 10 barely helps- Zipf 50 tables approximates uniform 5 tables." />
    </a>


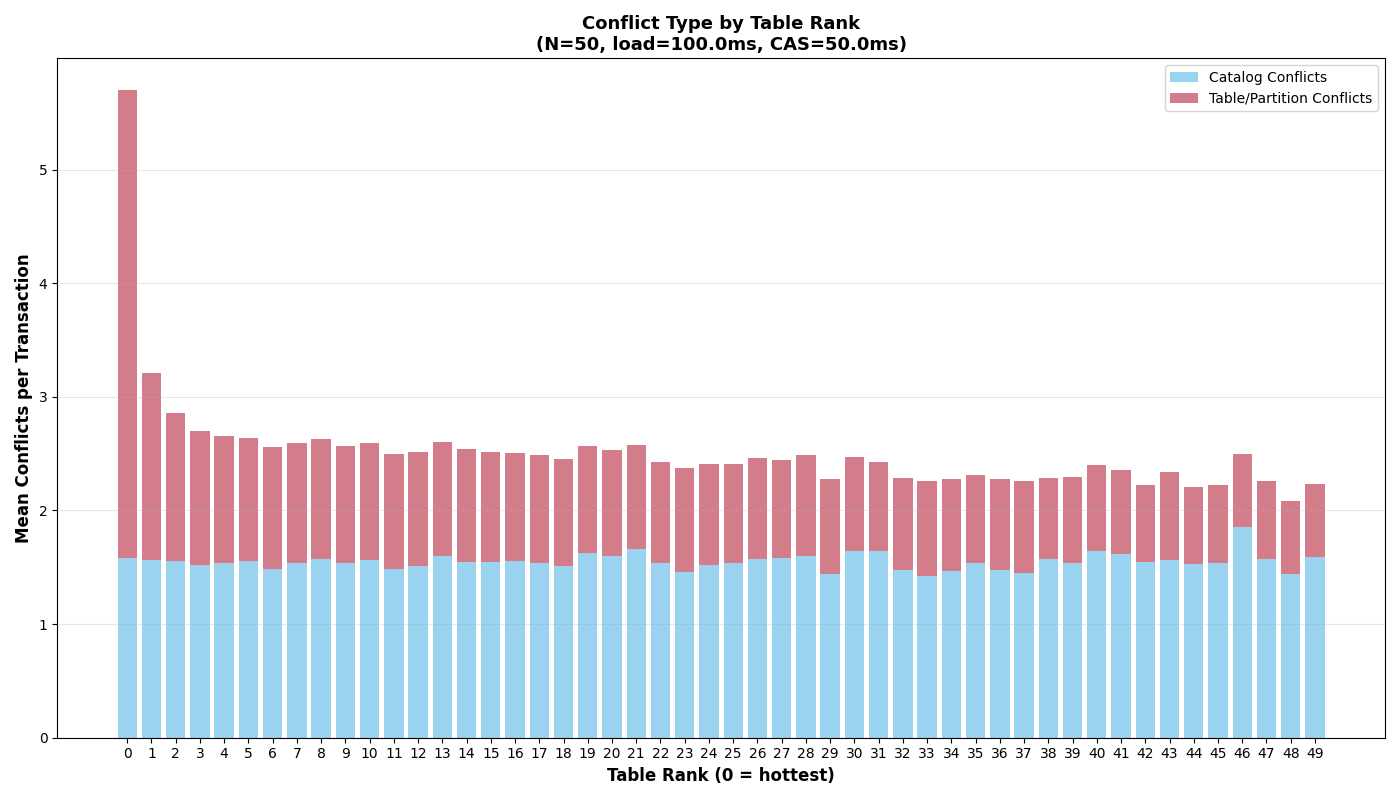
    <a href="/images/2026/03/providercatalog/exp4a_zipf_tables_fa/cas_50ms/conflict_type_by_table_t50_s100.png" class="glightbox" data-gallery="exp4a_tables_zipf_50ms-exp-4a-zipfian-table-selection-fa-only-50ms-cas-the-rank-1-table-dominates-collapsing-the-benefit-of-additional-tables" data-description="Exp 4a: Conflict type breakdown by table rank at 50 tables, ias=100ms, Zipf 50ms CAS. Rank-1 table dominates with ~44% of writes and mostly same-table (tblptn) conflicts. Cold tables (rank 10+) have more catalog conflicts than table conflicts.">
      <img src="/images/2026/03/providercatalog/exp4a_zipf_tables_fa/cas_50ms/conflict_type_by_table_t50_s100.png" alt="Exp 4a: Conflict type breakdown by table rank at 50 tables, ias=100ms, Zipf 50ms CAS. Rank-1 table dominates with ~44% of writes and mostly same-table (tblptn) conflicts. Cold tables (rank 10+) have more catalog conflicts than table conflicts." />
    </a>


    <a href="/images/2026/03/providercatalog/exp4a_zipf_tables_fa/cas_50ms/xheatmap_mean_latency.png" class="glightbox" data-gallery="exp4a_tables_zipf_50ms-exp-4a-zipfian-table-selection-fa-only-50ms-cas-the-rank-1-table-dominates-collapsing-the-benefit-of-additional-tables" data-description="Exp 4a: Zipfian mean commit latency by table count and inter-arrival, 50ms CAS. 1 table at 20ms is 1928ms, 50 tables is 1384ms. At 5000ms, baseline is 525-579ms. Gap between table counts is smaller than uniform because the hot table dominates." style="display:none">
    </a>


    <a href="/images/2026/03/providercatalog/exp4a_zipf_tables_fa/cas_50ms/xheatmap_p99_latency.png" class="glightbox" data-gallery="exp4a_tables_zipf_50ms-exp-4a-zipfian-table-selection-fa-only-50ms-cas-the-rank-1-table-dominates-collapsing-the-benefit-of-additional-tables" data-description="Exp 4a: Zipfian p99 commit latency by table count and inter-arrival, 50ms CAS. 1 table at 20ms is 3615ms, 50 tables is 2801ms. At 5000ms, p99 ranges 811-961ms. Tails are worse than uniform because the hot table sees concentrated contention." style="display:none">
    </a>


    <figcaption>Exp 4a: Zipfian table selection FA-only (50ms CAS). The rank-1 table dominates, collapsing the benefit of additional tables.
</figcaption>
  
</figure>

<p>The rank-1 table behaves approximately like a single table at half the global
arrival rate, with a small penalty from catalog conflicts. At low load, rank-1
success rates and latencies converge to the single-table baseline; at high load,
catalog conflicts from other tables’ writes consume part of the retry budget,
degrading success rates below the single-table equivalent.</p>

<p>Under Zipf, 70% of retries are same-table conflicts (requiring manifest I/O),
compared to ~2% under uniform distribution with 50 tables. Adding physical
tables beyond 10 barely helps- Zipf with 50 tables performs like uniform with ~5
tables.<sup id="fnref:moreplots" role="doc-noteref"><a href="#fn:moreplots" class="footnote" rel="footnote">1</a></sup> This is unsurprising, given that additional tables shift
diminishing fractions of the workload.</p>

<figure class="half ">


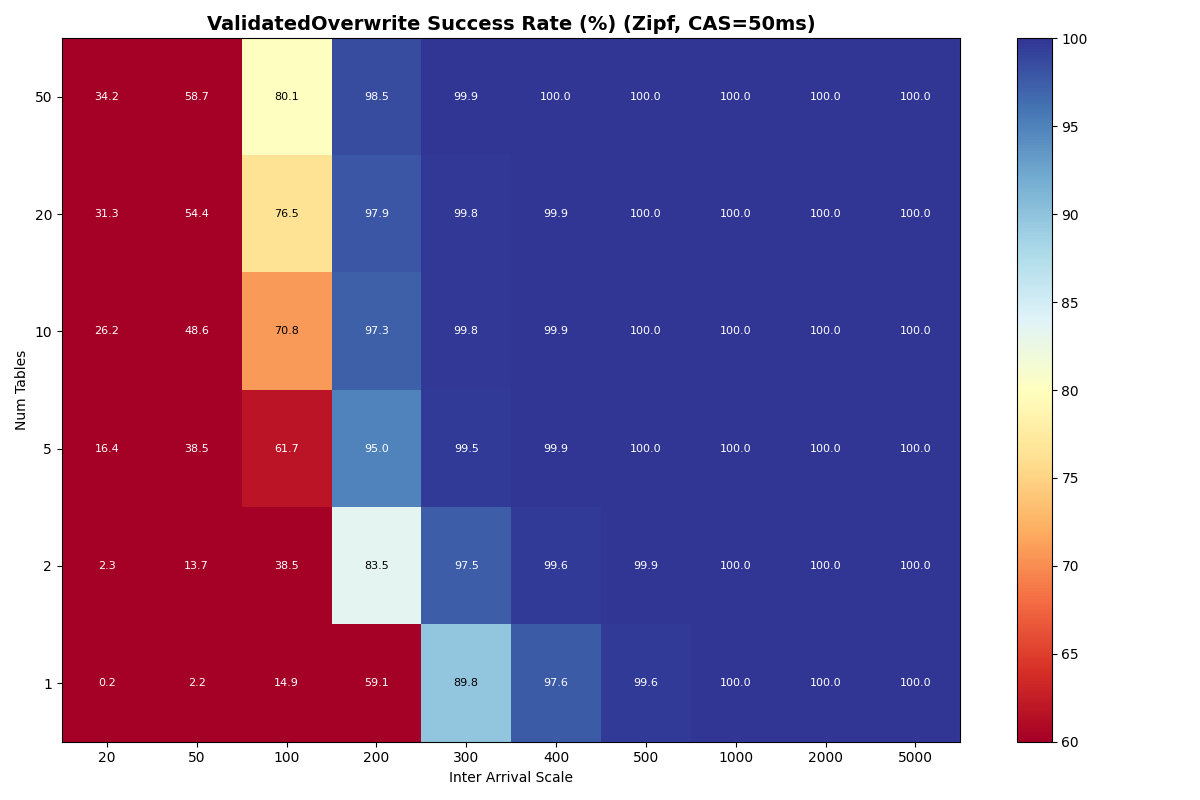
    <a href="/images/2026/03/providercatalog/exp4b_zipf_tables_mix/cas_50ms/heatmap_vo_success_rate.png" class="glightbox" data-gallery="exp4b_tables_zipf_50ms-exp-4b-zipfian-table-selection-90-10-fa-vo-50ms-cas-the-rank-1-table-dominates-collapsing-the-benefit-of-additional-tables" data-description="Exp 4b: Zipfian VO success rate (90/10 mix) by table count and inter-arrival, 50ms CAS. VO benefits from table partitioning but less than uniform: 50 tables at 100ms reaches ~75%, 10 tables at 100ms ~68%. 1 table at 100ms is ~47%. The hot table concentrates per-table conflicts, limiting the benefit of additional tables.">
      <img src="/images/2026/03/providercatalog/exp4b_zipf_tables_mix/cas_50ms/heatmap_vo_success_rate.png" alt="Exp 4b: Zipfian VO success rate (90/10 mix) by table count and inter-arrival, 50ms CAS. VO benefits from table partitioning but less than uniform: 50 tables at 100ms reaches ~75%, 10 tables at 100ms ~68%. 1 table at 100ms is ~47%. The hot table concentrates per-table conflicts, limiting the benefit of additional tables." />
    </a>


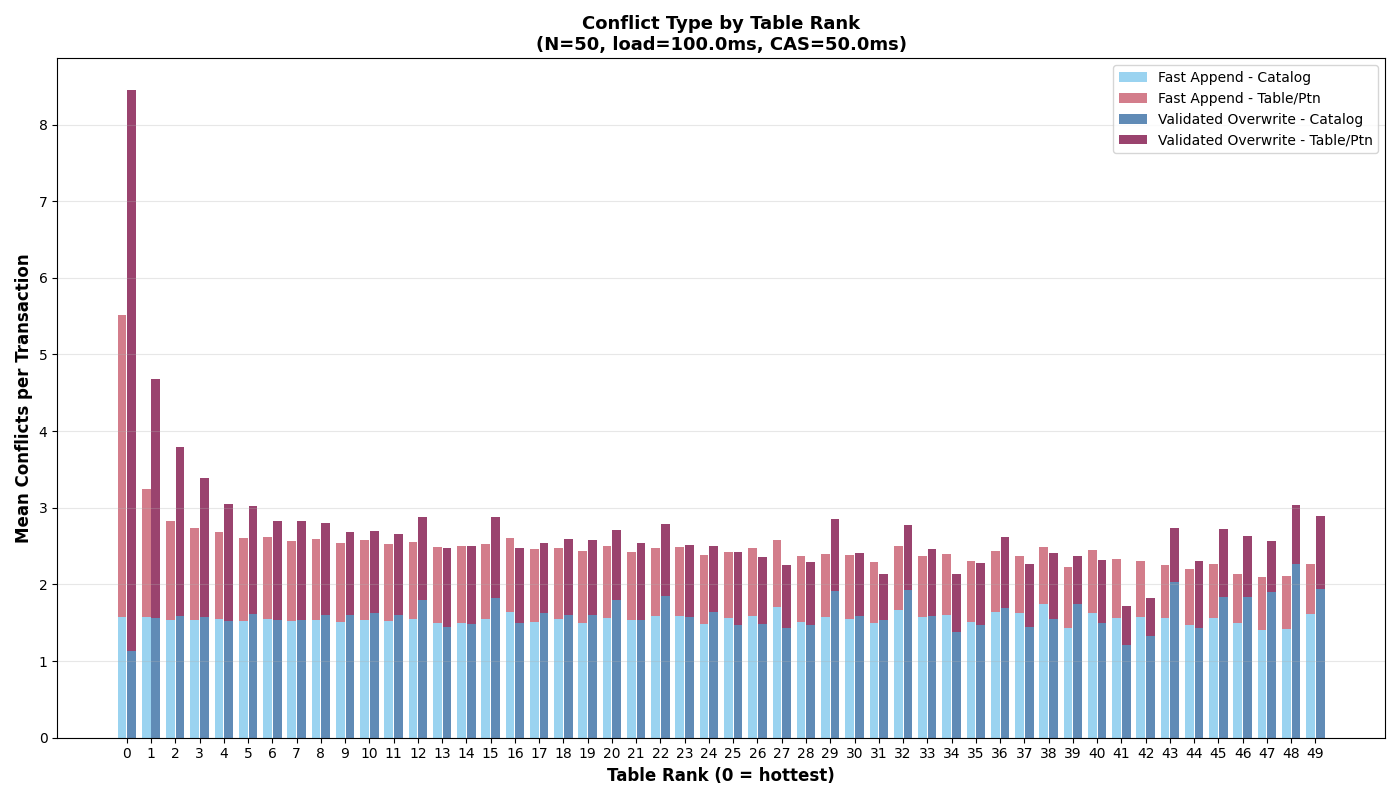
    <a href="/images/2026/03/providercatalog/exp4b_zipf_tables_mix/cas_50ms/conflict_type_by_table_t50_s100.png" class="glightbox" data-gallery="exp4b_tables_zipf_50ms-exp-4b-zipfian-table-selection-90-10-fa-vo-50ms-cas-the-rank-1-table-dominates-collapsing-the-benefit-of-additional-tables" data-description="Exp 4b: Conflict type breakdown by table rank at 50 tables, ias=100ms, Zipf 50ms CAS, 90/10 mix. Rank-1 table dominates with ~4.7 FA table/partition conflicts per transaction and ~2.4 catalog conflicts uniformly across ranks. Cold tables (rank 10+) have mostly catalog conflicts.">
      <img src="/images/2026/03/providercatalog/exp4b_zipf_tables_mix/cas_50ms/conflict_type_by_table_t50_s100.png" alt="Exp 4b: Conflict type breakdown by table rank at 50 tables, ias=100ms, Zipf 50ms CAS, 90/10 mix. Rank-1 table dominates with ~4.7 FA table/partition conflicts per transaction and ~2.4 catalog conflicts uniformly across ranks. Cold tables (rank 10+) have mostly catalog conflicts." />
    </a>


    <a href="/images/2026/03/providercatalog/exp4b_zipf_tables_mix/cas_50ms/heatmap_fa_success_rate.png" class="glightbox" data-gallery="exp4b_tables_zipf_50ms-exp-4b-zipfian-table-selection-90-10-fa-vo-50ms-cas-the-rank-1-table-dominates-collapsing-the-benefit-of-additional-tables" data-description="Exp 4b: Zipfian FA success rate (90/10 mix) by table count and inter-arrival, 50ms CAS. Similar to exp4a Zipf FA-only: 50 tables at 100ms reaches ~82%, 10 tables at 100ms ~79%. FA success is insensitive to VO in the mix." style="display:none">
    </a>


    <a href="/images/2026/03/providercatalog/exp4b_zipf_tables_mix/cas_50ms/xheatmap_fa_mean_latency.png" class="glightbox" data-gallery="exp4b_tables_zipf_50ms-exp-4b-zipfian-table-selection-90-10-fa-vo-50ms-cas-the-rank-1-table-dominates-collapsing-the-benefit-of-additional-tables" data-description="Exp 4b: Zipfian FA mean latency (90/10 mix) by table count and inter-arrival, 50ms CAS. 1 table at 5000ms is ~579ms, 1 table at 20ms is ~1928ms. 50 tables at 5000ms is ~525ms. Pattern similar to exp4a Zipf." style="display:none">
    </a>


    <a href="/images/2026/03/providercatalog/exp4b_zipf_tables_mix/cas_50ms/xheatmap_vo_mean_latency.png" class="glightbox" data-gallery="exp4b_tables_zipf_50ms-exp-4b-zipfian-table-selection-90-10-fa-vo-50ms-cas-the-rank-1-table-dominates-collapsing-the-benefit-of-additional-tables" data-description="Exp 4b: Zipfian VO mean latency (90/10 mix) by table count and inter-arrival, 50ms CAS. VO latency at moderate load remains in the multi-second range even with many tables. At 5000ms, latencies approach ~500ms baseline; at high load, 1 table peaks at tens of seconds. Hatched cells in lower-left indicate low success rates." style="display:none">
    </a>


    <a href="/images/2026/03/providercatalog/exp4b_zipf_tables_mix/cas_120ms/heatmap_vo_success_rate.png" class="glightbox" data-gallery="exp4b_tables_zipf_50ms-exp-4b-zipfian-table-selection-90-10-fa-vo-50ms-cas-the-rank-1-table-dominates-collapsing-the-benefit-of-additional-tables" data-description="Exp 4b: Zipfian VO success rate (90/10 mix) by table count and inter-arrival, 120ms CAS. 50 tables at 200ms reaches the mid-90s, 50 tables at 100ms ~57%. 1 table at 200ms is in the 60s. High CAS latency limits VO viability, especially for single tables." style="display:none">
    </a>


    <a href="/images/2026/03/providercatalog/exp4b_zipf_tables_mix/cas_120ms/xheatmap_vo_mean_latency.png" class="glightbox" data-gallery="exp4b_tables_zipf_50ms-exp-4b-zipfian-table-selection-90-10-fa-vo-50ms-cas-the-rank-1-table-dominates-collapsing-the-benefit-of-additional-tables" data-description="Exp 4b: Zipfian VO mean latency (90/10 mix) by table count and inter-arrival, 120ms CAS. VO latency at 120ms CAS under Zipf is high: at 5000ms, baseline approaches ~1 second; at high load, peaks in the tens of seconds. Most left-region cells are hatched." style="display:none">
    </a>


    <figcaption>Exp 4b: Zipfian table selection 90/10 FA/VO (50ms CAS). The rank-1 table dominates, collapsing the benefit of additional tables.
</figcaption>
  
</figure>

<p>Adding back VO transactions to the zipfian distribution, we see a similar
effect: the most popular table converges to single-table performance, VO
transactions are more sensitive (particularly at high load) to catalog
conflicts, and sustainable single-table throughput with VO transactions is much
lower. Catalog conflicts are evenly distributed across tables, but the most popular
table also accumulates per-table conflicts where VO transactions struggle to
complete at high load.</p>

<p><strong>Takeaway</strong>: Uniform distribution shows partitioning is effective, until the
CAS latency becomes the bottleneck. When the distribution is skewed (zipfian),
retries from popular tables have minimal impact on other tables. These results
also suggest that <em>catalog and table conflicts should be handled separately</em> by
the retry policy. While these simulations assume a steady arrival rate following
a distribution, many real workloads burst in a particular table. Exponential
backoff for table conflicts and immediate retry for catalog conflicts would be
more effective for that workload.</p>

<h2 id="4c-multiple-tables-varied-workload-ratio-measured-cas-distributions">4c. Multiple tables, varied workload ratio, measured CAS distributions</h2>
<p><a id="exp4c"></a></p>

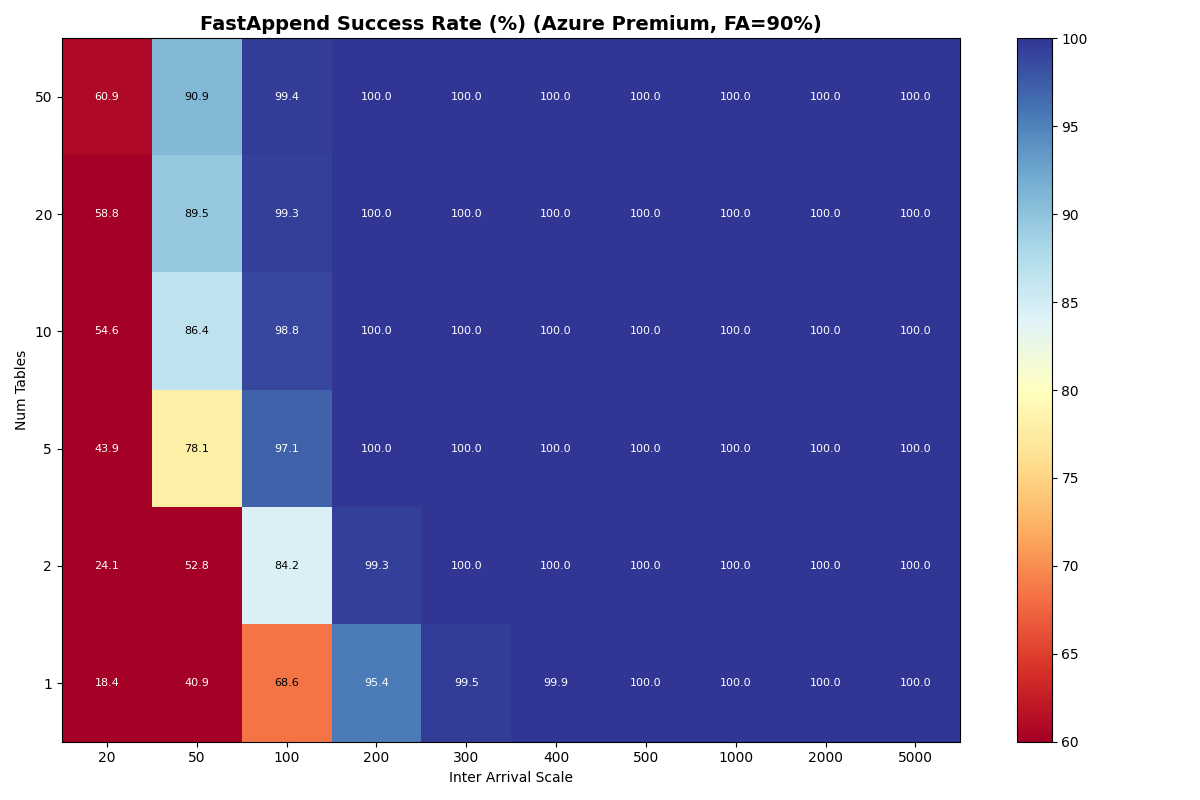
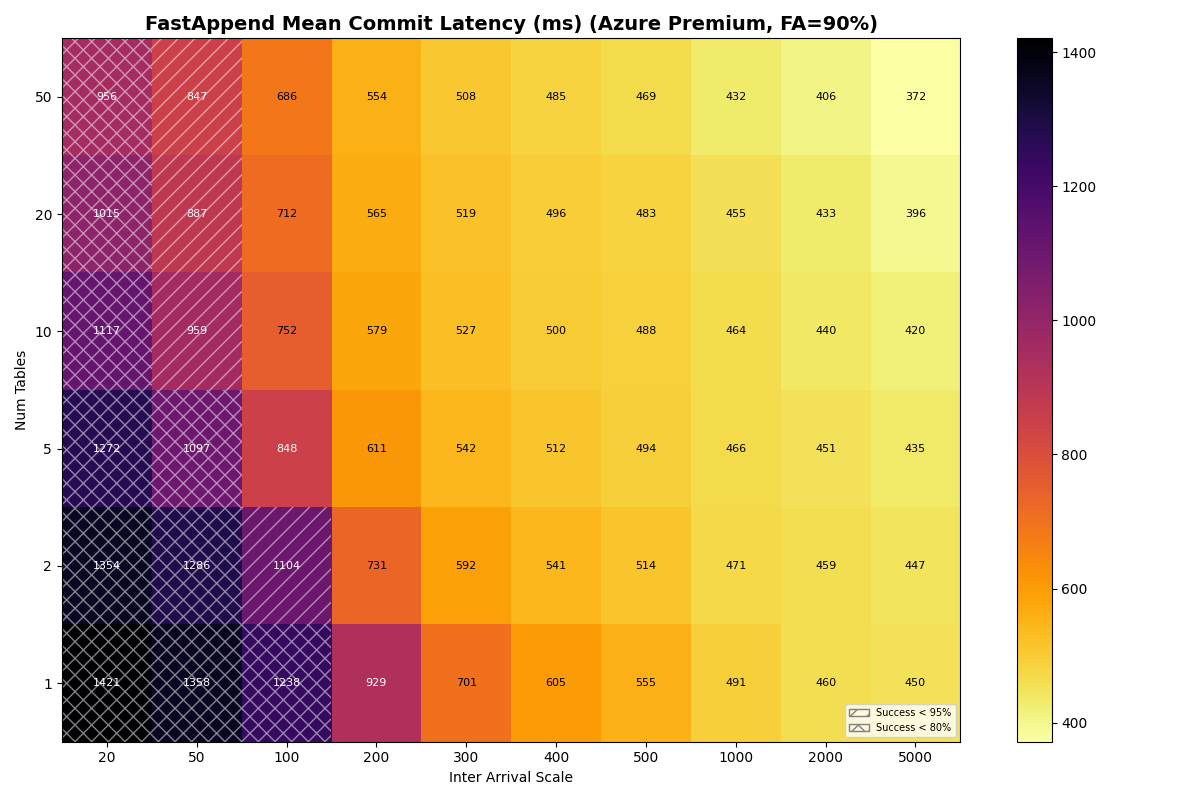
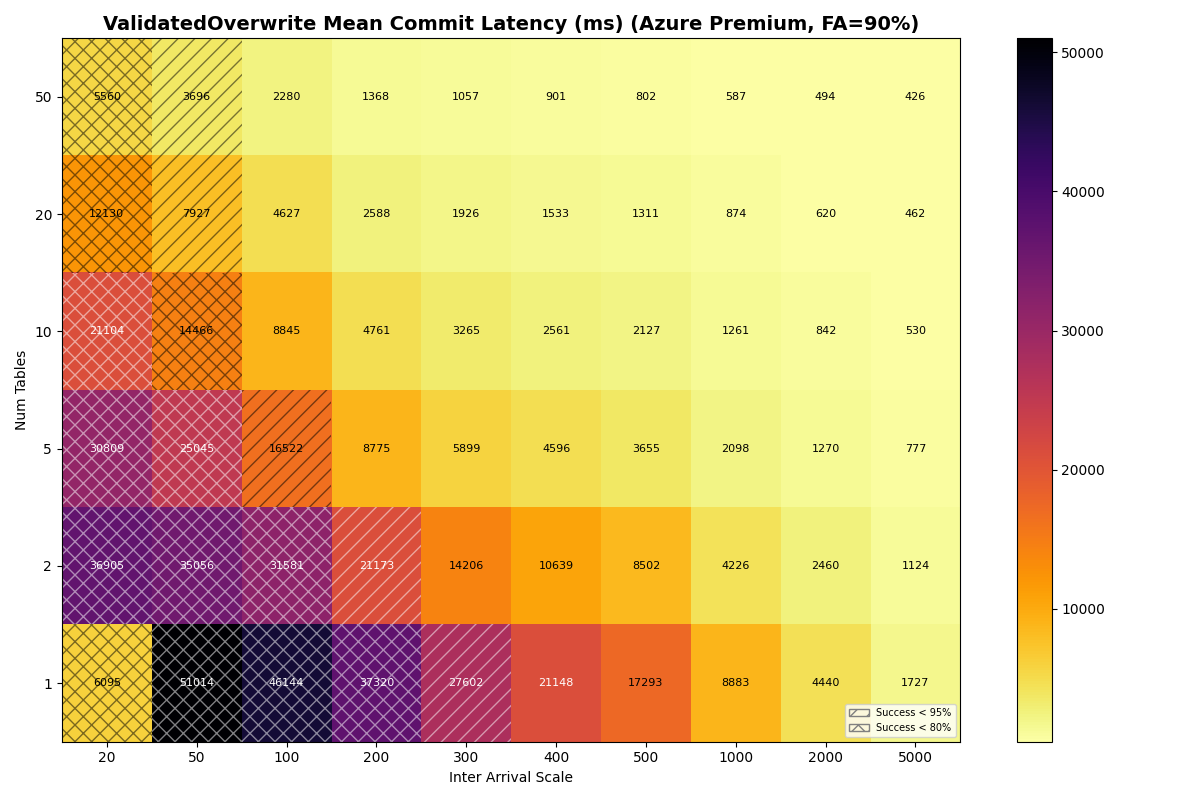
<p>Real provider CAS latencies (22-170ms) fall well above the 1-10ms sweet spot
from 4a/4b, so most workloads will operate in the regime where CAS latency
limits throughput. Now we substitute the CAS latencies
<a href="/posts/2026/01/conditional">measured</a> for each provider and published
unconditional read/write latencies. The <a href="#appendix-b">full results</a> are in
Appendix B.</p>

<p>We’re assigning labels to these distributions matching observations from each
provider, but this is still a <em>model</em> of the commit protocol. We’re interested
less in hitting the moving target of real provider performance and more in
learning from the model: when does CAS latency become the bottleneck? (When) does
storage variability (modeled as a lognormal distribution) impact commit success
rates?</p>

<p>The synthetic parameter sweeps in 4a/4b varied CAS latency and workload to
measure commit success rates/latency <em>holding the provider (S3) constant</em>. Now
we want to see how different provider profiles interact with workload mixes and
table counts.</p>

<details>
  <summary>Latency distributions for storage providers (click to expand)</summary>

  <h3 id="distribution-parameters-1">Distribution Parameters</h3>

  <h4 id="get-unconditional-read-1">GET (unconditional read)</h4>

  <p>Modeled as <code class="language-plaintext highlighter-rouge">Lognormal(mu=ln(median), sigma)</code>, floored at <code class="language-plaintext highlighter-rouge">min_latency_ms</code>.</p>

  <table>
    <thead>
      <tr>
        <th>Provider</th>
        <th style="text-align: right">median (ms)</th>
        <th style="text-align: right">sigma</th>
        <th style="text-align: right">min_latency (ms)</th>
      </tr>
    </thead>
    <tbody>
      <tr>
        <td>S3 Express</td>
        <td style="text-align: right">2.5</td>
        <td style="text-align: right">0.57</td>
        <td style="text-align: right">1</td>
      </tr>
      <tr>
        <td>S3 Standard</td>
        <td style="text-align: right">27</td>
        <td style="text-align: right">0.62</td>
        <td style="text-align: right">10</td>
      </tr>
      <tr>
        <td>Azure Premium</td>
        <td style="text-align: right">35</td>
        <td style="text-align: right">0.08</td>
        <td style="text-align: right">20</td>
      </tr>
      <tr>
        <td>Azure Standard</td>
        <td style="text-align: right">38</td>
        <td style="text-align: right">0.66</td>
        <td style="text-align: right">20</td>
      </tr>
      <tr>
        <td>GCS</td>
        <td style="text-align: right">200</td>
        <td style="text-align: right">0.30</td>
        <td style="text-align: right">80</td>
      </tr>
    </tbody>
  </table>

  <h4 id="put-unconditional-write-1">PUT (unconditional write)</h4>

  <p>Modeled as <code class="language-plaintext highlighter-rouge">Lognormal(mu=ln(base + rate * size_MiB), sigma)</code>, floored at <code class="language-plaintext highlighter-rouge">min_latency_ms</code>.</p>

  <table>
    <thead>
      <tr>
        <th>Provider</th>
        <th style="text-align: right">base (ms)</th>
        <th style="text-align: right">rate (ms/MiB)</th>
        <th style="text-align: right">sigma</th>
        <th style="text-align: right">min_latency (ms)</th>
      </tr>
    </thead>
    <tbody>
      <tr>
        <td>S3 Express</td>
        <td style="text-align: right">6.5</td>
        <td style="text-align: right">10</td>
        <td style="text-align: right">0.24</td>
        <td style="text-align: right">1</td>
      </tr>
      <tr>
        <td>S3 Standard</td>
        <td style="text-align: right">60</td>
        <td style="text-align: right">20</td>
        <td style="text-align: right">0.29</td>
        <td style="text-align: right">10</td>
      </tr>
      <tr>
        <td>Azure Premium</td>
        <td style="text-align: right">41</td>
        <td style="text-align: right">15</td>
        <td style="text-align: right">0.10</td>
        <td style="text-align: right">20</td>
      </tr>
      <tr>
        <td>Azure Standard</td>
        <td style="text-align: right">45</td>
        <td style="text-align: right">25</td>
        <td style="text-align: right">0.50</td>
        <td style="text-align: right">20</td>
      </tr>
      <tr>
        <td>GCS</td>
        <td style="text-align: right">200</td>
        <td style="text-align: right">17</td>
        <td style="text-align: right">0.30</td>
        <td style="text-align: right">80</td>
      </tr>
    </tbody>
  </table>

  <h4 id="get-percentiles">GET Percentiles</h4>

  <table>
    <thead>
      <tr>
        <th>Provider</th>
        <th style="text-align: right">p5</th>
        <th style="text-align: right">p10</th>
        <th style="text-align: right">p25</th>
        <th style="text-align: right">p50</th>
        <th style="text-align: right">p75</th>
        <th style="text-align: right">p90</th>
        <th style="text-align: right">p95</th>
        <th style="text-align: right">p99</th>
      </tr>
    </thead>
    <tbody>
      <tr>
        <td>S3 Express</td>
        <td style="text-align: right">1</td>
        <td style="text-align: right">1</td>
        <td style="text-align: right">2</td>
        <td style="text-align: right">2</td>
        <td style="text-align: right">4</td>
        <td style="text-align: right">5</td>
        <td style="text-align: right">6</td>
        <td style="text-align: right">9</td>
      </tr>
      <tr>
        <td>S3 Standard</td>
        <td style="text-align: right">10</td>
        <td style="text-align: right">12</td>
        <td style="text-align: right">18</td>
        <td style="text-align: right">27</td>
        <td style="text-align: right">41</td>
        <td style="text-align: right">60</td>
        <td style="text-align: right">75</td>
        <td style="text-align: right">114</td>
      </tr>
      <tr>
        <td>Azure Premium</td>
        <td style="text-align: right">31</td>
        <td style="text-align: right">32</td>
        <td style="text-align: right">33</td>
        <td style="text-align: right">35</td>
        <td style="text-align: right">37</td>
        <td style="text-align: right">39</td>
        <td style="text-align: right">40</td>
        <td style="text-align: right">42</td>
      </tr>
      <tr>
        <td>Azure Standard</td>
        <td style="text-align: right">20</td>
        <td style="text-align: right">20</td>
        <td style="text-align: right">24</td>
        <td style="text-align: right">38</td>
        <td style="text-align: right">59</td>
        <td style="text-align: right">89</td>
        <td style="text-align: right">113</td>
        <td style="text-align: right">176</td>
      </tr>
      <tr>
        <td>GCS</td>
        <td style="text-align: right">122</td>
        <td style="text-align: right">136</td>
        <td style="text-align: right">163</td>
        <td style="text-align: right">200</td>
        <td style="text-align: right">245</td>
        <td style="text-align: right">294</td>
        <td style="text-align: right">328</td>
        <td style="text-align: right">402</td>
      </tr>
    </tbody>
  </table>

  <h4 id="put-percentiles">PUT Percentiles</h4>

  <table>
    <thead>
      <tr>
        <th>Provider</th>
        <th style="text-align: right">p5</th>
        <th style="text-align: right">p10</th>
        <th style="text-align: right">p25</th>
        <th style="text-align: right">p50</th>
        <th style="text-align: right">p75</th>
        <th style="text-align: right">p90</th>
        <th style="text-align: right">p95</th>
        <th style="text-align: right">p99</th>
      </tr>
    </thead>
    <tbody>
      <tr>
        <td>S3 Express</td>
        <td style="text-align: right">4</td>
        <td style="text-align: right">5</td>
        <td style="text-align: right">6</td>
        <td style="text-align: right">7</td>
        <td style="text-align: right">8</td>
        <td style="text-align: right">9</td>
        <td style="text-align: right">10</td>
        <td style="text-align: right">12</td>
      </tr>
      <tr>
        <td>S3 Standard</td>
        <td style="text-align: right">37</td>
        <td style="text-align: right">42</td>
        <td style="text-align: right">50</td>
        <td style="text-align: right">60</td>
        <td style="text-align: right">73</td>
        <td style="text-align: right">87</td>
        <td style="text-align: right">97</td>
        <td style="text-align: right">118</td>
      </tr>
      <tr>
        <td>Azure Premium</td>
        <td style="text-align: right">35</td>
        <td style="text-align: right">36</td>
        <td style="text-align: right">39</td>
        <td style="text-align: right">41</td>
        <td style="text-align: right">44</td>
        <td style="text-align: right">47</td>
        <td style="text-align: right">49</td>
        <td style="text-align: right">52</td>
      </tr>
      <tr>
        <td>Azure Standard</td>
        <td style="text-align: right">20</td>
        <td style="text-align: right">24</td>
        <td style="text-align: right">32</td>
        <td style="text-align: right">45</td>
        <td style="text-align: right">63</td>
        <td style="text-align: right">86</td>
        <td style="text-align: right">103</td>
        <td style="text-align: right">145</td>
      </tr>
      <tr>
        <td>GCS</td>
        <td style="text-align: right">122</td>
        <td style="text-align: right">136</td>
        <td style="text-align: right">164</td>
        <td style="text-align: right">200</td>
        <td style="text-align: right">245</td>
        <td style="text-align: right">294</td>
        <td style="text-align: right">328</td>
        <td style="text-align: right">402</td>
      </tr>
    </tbody>
  </table>

  <h4 id="provider-summary">Provider summary</h4>

  <table>
    <thead>
      <tr>
        <th>Provider</th>
        <th style="text-align: right">CAS median (ms)</th>
        <th style="text-align: right">CAS σ</th>
        <th style="text-align: right">Read base (ms)</th>
        <th style="text-align: right">Read σ</th>
        <th style="text-align: right">Write base (ms)</th>
        <th style="text-align: right">Write σ</th>
        <th style="text-align: right">Min latency (ms)</th>
      </tr>
    </thead>
    <tbody>
      <tr>
        <td>S3 Express</td>
        <td style="text-align: right">22</td>
        <td style="text-align: right">0.22</td>
        <td style="text-align: right">2.5</td>
        <td style="text-align: right">0.57</td>
        <td style="text-align: right">6.5</td>
        <td style="text-align: right">0.24</td>
        <td style="text-align: right">1</td>
      </tr>
      <tr>
        <td>S3</td>
        <td style="text-align: right">61</td>
        <td style="text-align: right">0.14</td>
        <td style="text-align: right">27</td>
        <td style="text-align: right">0.62</td>
        <td style="text-align: right">60</td>
        <td style="text-align: right">0.29</td>
        <td style="text-align: right">10</td>
      </tr>
      <tr>
        <td>Azure Premium</td>
        <td style="text-align: right">64</td>
        <td style="text-align: right">0.73</td>
        <td style="text-align: right">35</td>
        <td style="text-align: right">0.08</td>
        <td style="text-align: right">41</td>
        <td style="text-align: right">0.10</td>
        <td style="text-align: right">20</td>
      </tr>
      <tr>
        <td>Azure</td>
        <td style="text-align: right">93</td>
        <td style="text-align: right">0.82</td>
        <td style="text-align: right">38</td>
        <td style="text-align: right">0.66</td>
        <td style="text-align: right">45</td>
        <td style="text-align: right">0.50</td>
        <td style="text-align: right">20</td>
      </tr>
      <tr>
        <td>GCP</td>
        <td style="text-align: right">170</td>
        <td style="text-align: right">0.91</td>
        <td style="text-align: right">200</td>
        <td style="text-align: right">0.30</td>
        <td style="text-align: right">200</td>
        <td style="text-align: right">0.30</td>
        <td style="text-align: right">80</td>
      </tr>
    </tbody>
  </table>

</details>
<p><br /></p>

<h3 id="single-table-provider-performance"><strong>Single-table</strong> Provider Performance</h3>

<figure>

  <table>
    <thead>
      <tr>
        <th>Provider</th>
        <th style="text-align: right">100/0 (c/s)</th>
        <th style="text-align: right">100/0 (FA/VO lat)</th>
        <th style="text-align: right">90/10 (c/s)</th>
        <th style="text-align: right">90/10 (FA/VO lat)</th>
        <th style="text-align: right">50/50 (c/s)</th>
        <th style="text-align: right">50/50 (FA/VO lat)</th>
      </tr>
    </thead>
    <tbody>
      <tr>
        <td>s3x</td>
        <td style="text-align: right">14.6</td>
        <td style="text-align: right">0.16s / —</td>
        <td style="text-align: right">7.4</td>
        <td style="text-align: right">0.11s / 6.7s</td>
        <td style="text-align: right">7.4</td>
        <td style="text-align: right">0.11s / 6.7s</td>
      </tr>
      <tr>
        <td>s3</td>
        <td style="text-align: right">1.8</td>
        <td style="text-align: right">1.00s / —</td>
        <td style="text-align: right">1.8</td>
        <td style="text-align: right">1.01s / 20.2s</td>
        <td style="text-align: right">1.8</td>
        <td style="text-align: right">0.99s / 20.0s</td>
      </tr>
      <tr>
        <td>azurex</td>
        <td style="text-align: right">2.4</td>
        <td style="text-align: right">1.12s / —</td>
        <td style="text-align: right">1.8</td>
        <td style="text-align: right">0.89s / 21.7s</td>
        <td style="text-align: right">1.8</td>
        <td style="text-align: right">0.87s / 21.2s</td>
      </tr>
      <tr>
        <td>azure</td>
        <td style="text-align: right">1.8</td>
        <td style="text-align: right">1.50s / —</td>
        <td style="text-align: right">1.5</td>
        <td style="text-align: right">1.26s / 22.6s</td>
        <td style="text-align: right">1.5</td>
        <td style="text-align: right">1.25s / 23.8s</td>
      </tr>
      <tr>
        <td>gcp</td>
        <td style="text-align: right">0.4</td>
        <td style="text-align: right">4.56s / —</td>
        <td style="text-align: right">0.4</td>
        <td style="text-align: right">4.60s / 32.9s</td>
        <td style="text-align: right">0.4</td>
        <td style="text-align: right">4.62s / 30.1s</td>
      </tr>
    </tbody>
  </table>

  <figcaption>Provider throughput and mean FA/VO latencies for a single-table where over 95% of VO transactions succeed</figcaption>
</figure>

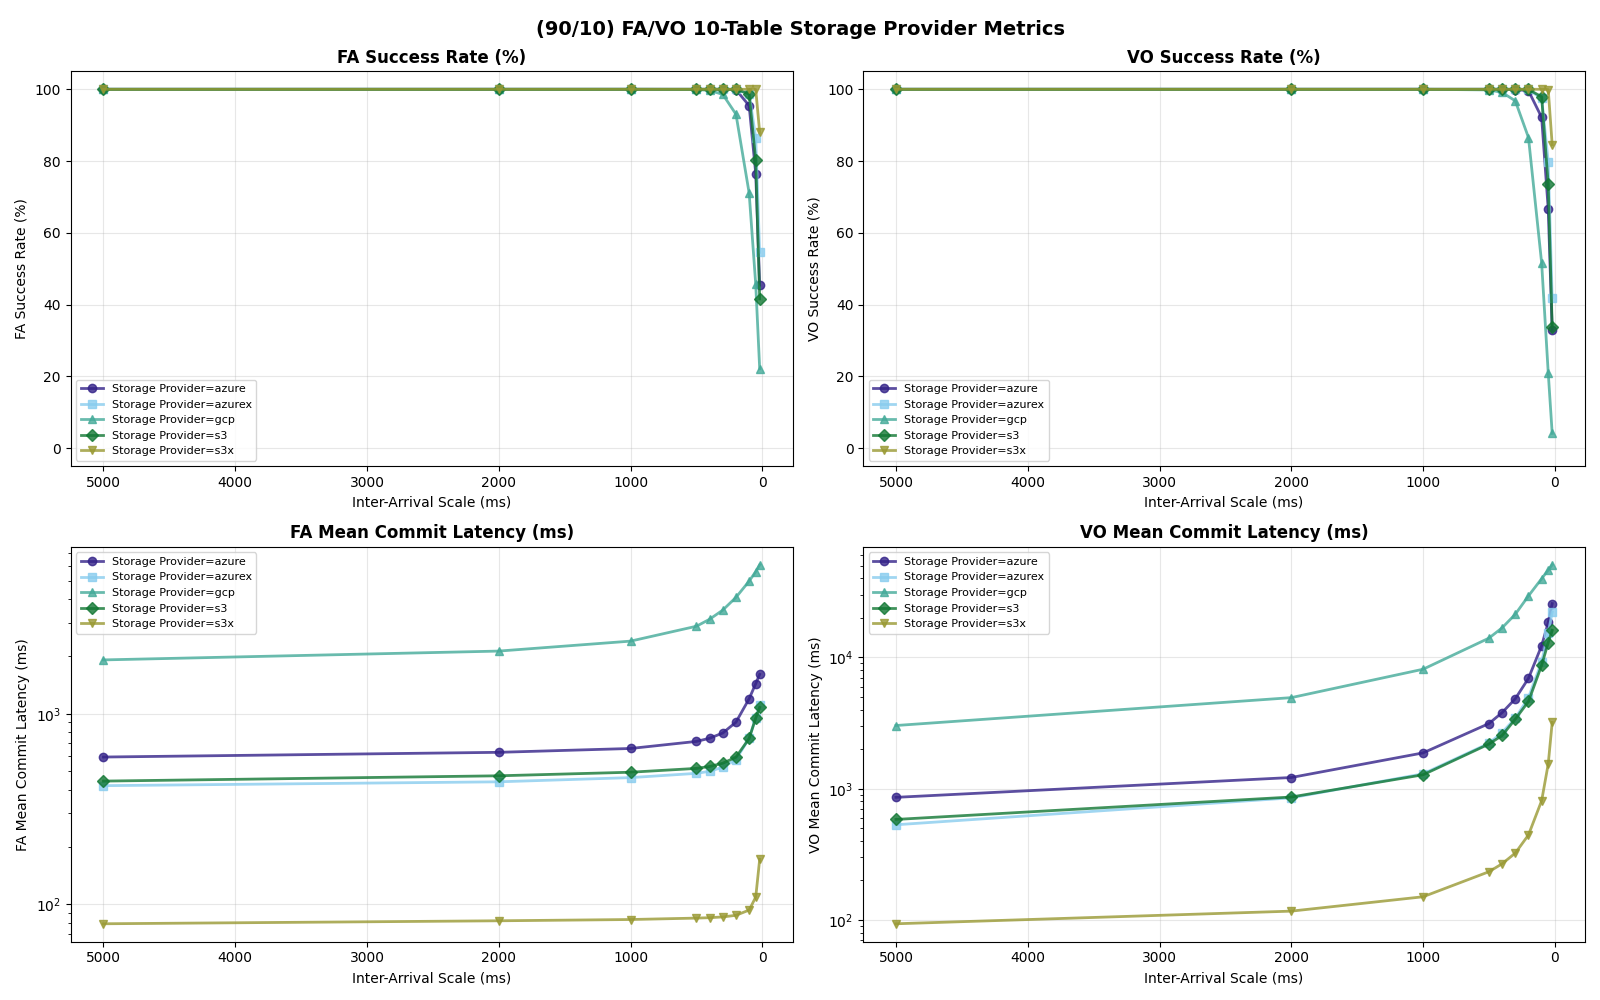
<p>In the commit path, I/O latency for metadata is the dominant factor across
providers. S3 Express One Zone is in its own class on this workload, delivering
3-6x the throughput of the next tier (S3 Standard, Azure Premium, Azure
Standard) and up to 20x the throughput of GCS. Its low latency and low variance
for both reads and writes compress the entire commit pipeline.</p>

<p>To accommodate 10% VO transactions, even S3x requires a 2x reduction in
throughput to keep success rates above 95%.</p>

<figure class="center ">


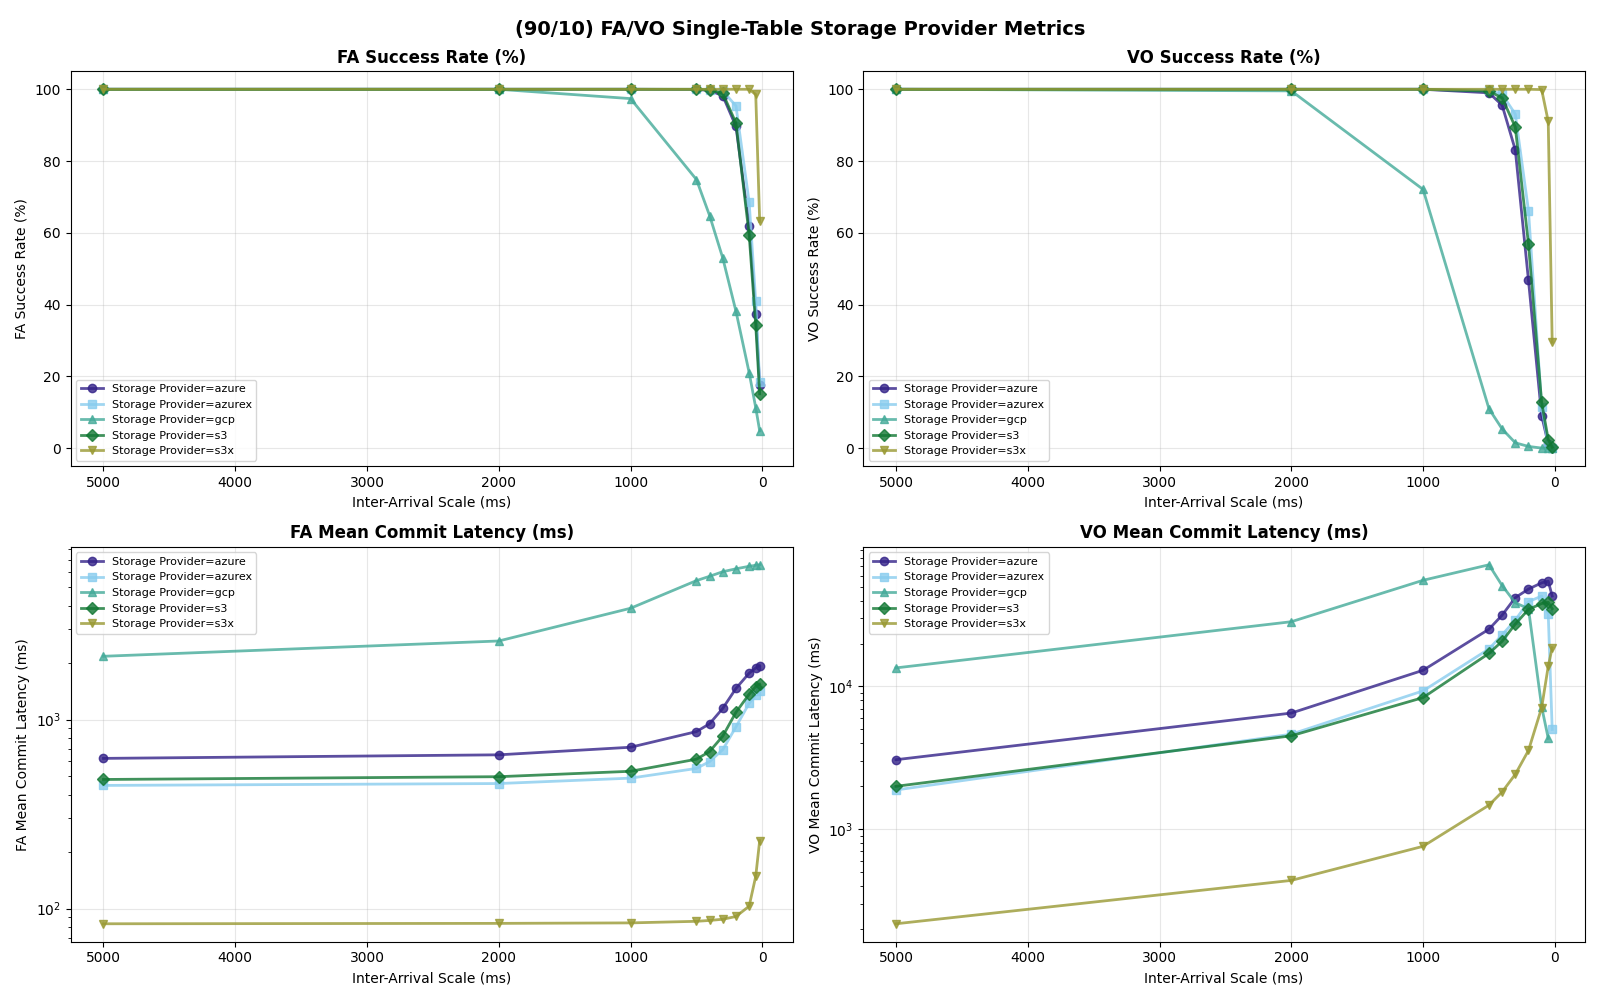
    <a href="/images/2026/03/providercatalog/exp4c_tables_providers/op_types_fa90_1t/op_type_vs_load.png" class="glightbox" data-gallery="exp4c_single_table_summary-single-table-provider-performance-in-90-10-fa-vo-workloads" data-description="Exp 4c: Single-table 90/10 FA/VO provider metrics. Four panels show FA success rate, VO success rate, FA mean latency, and VO mean latency vs inter-arrival scale. S3x sustains FA at 100% from ~100ms; S3, Azure Premium, and Azure Standard reach ~99% only near 500ms; GCP does not reach 99% until ~2000ms. VO success drops much earlier than FA for all providers.">
      <img src="/images/2026/03/providercatalog/exp4c_tables_providers/op_types_fa90_1t/op_type_vs_load.png" alt="Exp 4c: Single-table 90/10 FA/VO provider metrics. Four panels show FA success rate, VO success rate, FA mean latency, and VO mean latency vs inter-arrival scale. S3x sustains FA at 100% from ~100ms; S3, Azure Premium, and Azure Standard reach ~99% only near 500ms; GCP does not reach 99% until ~2000ms. VO success drops much earlier than FA for all providers." />
    </a>


    <figcaption><strong>Single-table</strong> provider performance in 90/10 FA/VO workloads
</figcaption>
  
</figure>

<h3 id="multiple-tables">Multiple tables</h3>

<p>With uniform table selection, partitioned workloads fall into three performance
tiers:</p>

<p><strong>s3x (14.9 c/s at 10 tables, up to 36 c/s at 20+ tables) » s3 / azurex / azure (3.7 c/s) » gcp (0.7 c/s simulated, ~0.7 actual)</strong></p>

<p>For S3, Azure Premium, and Azure Standard the usable rate plateaus at <strong>3.7
c/s</strong> from 5 tables through 20 tables. The per-table ceiling at S3 median
latencies is ~5.7 c/s (five serial S3 ops per attempt), so the aggregate
knee lines up with the catalog-CAS rate taking over only when per-table
offered load drops far enough. That happens at <strong>50 tables</strong> for S3 Standard
FA-only, where the knee jumps to 7.2 c/s — but adding even 10% VO pulls it
back down to 3.7 c/s. Azure Premium and Azure Standard stay at 3.7 c/s all
the way through 50 tables.</p>

<p>This tier is narrower than it looks. Adding tables beyond ~5 buys little for
S3/Azure on mixed workloads: the per-table metadata pipeline is the binding
constraint, not the catalog round-trip.</p>

<h4 id="outliers-s3-express-one-zone-s3x-and-gcp">Outliers: S3 Express One Zone (S3x) and GCP</h4>

<p>S3x benefits from partitioning immediately and keeps benefiting. Its
single-table knee is 14.6 c/s FA-only (7.4 c/s mixed); with 2+ tables mixed
workloads also sustain 14.9 c/s. Beyond 20 tables FA-only, cross-table CAS
contention still dominates but each failure costs only a re-CAS (manifest I/O
is skipped for disjoint-table conflicts), so the usable FA-only rate jumps to
~36 c/s at 20–50 tables.</p>

<p>The simulated GCP rate is <strong>0.7 c/s</strong> at 50 tables, up from 0.4 c/s at 1 table —
a much weaker curve than the other providers. GCS’s per-op latency is high
enough (~200 ms GET/PUT, ~170 ms CAS median) that each attempt costs roughly
590 ms even with a fast catalog, so per-table throughput caps at ~1.7 c/s and
the catalog CAS caps the aggregate at ~8.5 c/s. The real product is much
lower: GCS <a href="/posts/2026/01/conditional">measured</a> CAS throughput saturates at
0.8–1.4 op/s before any commit-protocol overhead.</p>

<h4 id="main-tier-s3-standard-azure-premium-azure-standard">Main tier: S3 Standard, Azure Premium, Azure Standard</h4>

<p>The other three stores are more interesting. S3 and Azure Premium have similar
CAS medians (61 vs 64ms), but Azure Premium’s CAS sigma is 5x larger (0.73 vs
0.14). Azure is worse on both axes: higher median (93ms) and higher sigma
(0.82).</p>

<figure>

  <table>
    <thead>
      <tr>
        <th>Provider</th>
        <th style="text-align: right">CAS median</th>
        <th style="text-align: right">CAS σ</th>
        <th style="text-align: right">Read σ</th>
        <th style="text-align: right">Write σ</th>
      </tr>
    </thead>
    <tbody>
      <tr>
        <td>S3</td>
        <td style="text-align: right">61ms</td>
        <td style="text-align: right">0.14</td>
        <td style="text-align: right">0.62</td>
        <td style="text-align: right">0.29</td>
      </tr>
      <tr>
        <td>Azure Premium</td>
        <td style="text-align: right">64ms</td>
        <td style="text-align: right">0.73</td>
        <td style="text-align: right">0.08</td>
        <td style="text-align: right">0.10</td>
      </tr>
      <tr>
        <td>Azure</td>
        <td style="text-align: right">93ms</td>
        <td style="text-align: right">0.82</td>
        <td style="text-align: right">0.66</td>
        <td style="text-align: right">0.50</td>
      </tr>
    </tbody>
  </table>

  <figcaption>Provider lognormal distribution parameters</figcaption>
</figure>

<p>In this model, both Azure Premium and Standard have higher CAS variance, but
Premium has very tight read/write variance; its I/O is predictable even if the
CAS is noisy. At 10 tables all three stores land at the same 3.7 c/s knee —
they are all bound by the per-table metadata pipeline, not the catalog CAS.
Azure Standard’s wider I/O variance shows up in mean latency (1.33s vs S3/Azure
Premium’s 0.82s) and VO mean latency (6.8s vs 4.7s).</p>

<figure>

  <table>
    <thead>
      <tr>
        <th>Provider</th>
        <th style="text-align: right">100/0 (c/s)</th>
        <th style="text-align: right">100/0 (FA/VO lat)</th>
        <th style="text-align: right">90/10 (c/s)</th>
        <th style="text-align: right">90/10 (FA/VO lat)</th>
        <th style="text-align: right">50/50 (c/s)</th>
        <th style="text-align: right">50/50 (FA/VO lat)</th>
      </tr>
    </thead>
    <tbody>
      <tr>
        <td>s3x</td>
        <td style="text-align: right">14.9</td>
        <td style="text-align: right">0.11s / —</td>
        <td style="text-align: right">14.9</td>
        <td style="text-align: right">0.12s / 1.4s</td>
        <td style="text-align: right">14.9</td>
        <td style="text-align: right">0.11s / 1.4s</td>
      </tr>
      <tr>
        <td>s3</td>
        <td style="text-align: right">3.7</td>
        <td style="text-align: right">0.82s / —</td>
        <td style="text-align: right">3.8</td>
        <td style="text-align: right">0.82s / 4.7s</td>
        <td style="text-align: right">3.7</td>
        <td style="text-align: right">0.82s / 4.6s</td>
      </tr>
      <tr>
        <td>azurex</td>
        <td style="text-align: right">3.7</td>
        <td style="text-align: right">0.82s / —</td>
        <td style="text-align: right">3.7</td>
        <td style="text-align: right">0.82s / 4.8s</td>
        <td style="text-align: right">3.7</td>
        <td style="text-align: right">0.81s / 4.8s</td>
      </tr>
      <tr>
        <td>azure</td>
        <td style="text-align: right">3.7</td>
        <td style="text-align: right">1.33s / —</td>
        <td style="text-align: right">3.7</td>
        <td style="text-align: right">1.33s / 6.8s</td>
        <td style="text-align: right">3.7</td>
        <td style="text-align: right">1.32s / 6.8s</td>
      </tr>
      <tr>
        <td>gcp</td>
        <td style="text-align: right">0.7</td>
        <td style="text-align: right">3.99s / —</td>
        <td style="text-align: right">0.7</td>
        <td style="text-align: right">4.01s / 8.6s</td>
        <td style="text-align: right">0.7</td>
        <td style="text-align: right">3.99s / 8.8s</td>
      </tr>
    </tbody>
  </table>

  <figcaption>Provider throughput and mean FA/VO latencies for 10 tables where over 95% of VO transactions succeed</figcaption>
</figure>

<figure class="center ">


    <a href="/images/2026/03/providercatalog/exp4c_tables_providers/op_types_fa90_10t/op_type_vs_load.png" class="glightbox" data-gallery="exp4c_10_table_summary-ten-table-provider-performance-in-90-10-fa-vo-workloads" data-description="Exp 4c: Ten-table 90/10 FA/VO provider metrics. Four panels show FA success rate, VO success rate, FA mean latency, and VO mean latency vs inter-arrival scale. VO success rates improve dramatically vs single-table: S3x reaches 100% VO at 50ms, S3 and Azure Premium reach ~93-99% VO at 100ms. VO mean latency drops significantly with table partitioning. GCP remains worst but also benefits.">
      <img src="/images/2026/03/providercatalog/exp4c_tables_providers/op_types_fa90_10t/op_type_vs_load.png" alt="Exp 4c: Ten-table 90/10 FA/VO provider metrics. Four panels show FA success rate, VO success rate, FA mean latency, and VO mean latency vs inter-arrival scale. VO success rates improve dramatically vs single-table: S3x reaches 100% VO at 50ms, S3 and Azure Premium reach ~93-99% VO at 100ms. VO mean latency drops significantly with table partitioning. GCP remains worst but also benefits." />
    </a>


    <figcaption><strong>Ten-table</strong> provider performance in 90/10 FA/VO workloads
</figcaption>
  
</figure>

<p>Put another way: when Azure Standard retries take 5-10x the median, they’re
almost certainly waste. In settings with high variance, commit protocols need to
minimize how often a retry attempt samples from a fat-tailed distribution. Azure
Standard’s higher variance shows up in FA mean latency (~1.33s vs S3/Azure
Premium ~0.82s) and in VO mean latency rather than in the sustainable rate, which
lands on the per-table bound at 3.7 c/s just like S3 and Azure Premium.</p>

<p><strong>Takeaway</strong>: S3x is in a different class for catalog-as-file workloads.
Distributing load across tables is effective, but store variance can drive
failure rates up even at low arrival rates.</p>

<h1 id="conclusion">Conclusion</h1>

<p>We tested two levers for improving commit throughput under contention: adding
tables and choosing a faster storage provider. Both help, but the gap between
them widened with the corrected per-attempt I/O cost.</p>

<p><strong>Provider choice matters more than table count.</strong> S3 Express sustains 14.6 c/s
(FA-only) on a single table — more per-table throughput than spreading the same
load across 20 tables on S3 Standard (3.7 c/s aggregate, ~0.18 c/s per table).
Fast storage compresses the entire commit pipeline (CAS + manifest I/O), while
adding tables only relieves catalog contention. For providers in the 1–2 c/s
single-table tier (S3, Azure Premium, Azure Standard), 5+ tables yield ~2x
aggregate scaling to 3.7 c/s and stall there; only at 50 tables does S3
Standard’s FA-only knee climb to 7.2 c/s.</p>

<p><strong>Table partitioning reduces VO retry cost.</strong> Each VO retry reads manifest lists
proportional to snapshots committed <em>to that table</em> since the read snapshot.
With more tables, each table sees fewer commits, and VO tail latency drops
accordingly. For S3 Standard 90/10 mix, VO mean latency falls from 20.2s at
1 table to 4.7s at 10 tables and 2.6s at 20 tables. S3 Express drops from
6.7s to 0.8s over the same range. Under Zipfian skew, the hot table still
converges to single-table performance, but catalog contention does not impact
the less popular tables.</p>

<p><strong>The protocol still matters at single-table scale.</strong> On a single table, VO
mean latency reaches tens of seconds at moderate throughput regardless of
provider (S3: 20.2s, Azure Premium: 21.7s, Azure Standard: 22.6s, GCP: 32.9s).
S3 Express’s 6.7s single-table VO mean is the lowest of any provider, though
still impractical for most production workloads.</p>

<p>Take the simulated provider experiments with a grain of salt: the labels we’re
putting on the storage distributions are drawn from measurements of real
systems, but these parameters do not completely describe reality. These are
<em>optimistic</em> models of provider performance. It is unlikely that real
workloads could sustain these rates without external coordination.</p>

<p>One practical takeaway: <em>catalog and table conflicts should be handled
separately</em> by the retry policy. Catalog conflicts are cheap to retry (re-read
the catalog, re-apply the CAS) while table conflicts require re-reading manifest
lists. Immediate retry for catalog conflicts and exponential backoff for table
conflicts would better match the cost structure.</p>

<p>More broadly, these simulations may be sufficient to indict the commit protocol.
Writing copy-on-write objects to storage on every commit attempt is a
self-imposed obstacle to scaling commit throughput, <em>more than writing to the
same catalog object in every commit</em>.</p>

<h1 id="correction-2026-06-09">Correction 2026-06-09</h1>

<p>The numbers in this post were regenerated on 2026-04-17 after finding some
simulator bugs, listed below. The qualitative conclusions survive- the tier
ordering and the “partitioning helps” story are intact- but the multi-table
knees moved substantially, in both directions: the 5-20 table knee for S3/Azure
drops by half, GCP scaling is much weaker than presented, and S3x at 20+ tables
jumps to roughly 2.5x the published rate.</p>

<ul>
  <li><strong>Per-attempt I/O cost corrected.</strong> Each commit attempt now issues
five S3 round-trips (<code class="language-plaintext highlighter-rouge">TM_read + ML_read + ML_write + TM_write + CAS</code>)
instead of three. The per-table ceiling at S3 medians tightens from
~7.7 c/s to <strong>5.7 c/s</strong>. For S3/Azure at 5–20 tables the knee drops
from ~7.4 to <strong>3.7 c/s</strong>: the per-table bound bites before the catalog
CAS does. Only at 50 tables does catalog CAS again become the bottleneck
(for S3 FA-only).</li>
  <li><strong>Cross-table CAS free retry.</strong> Multi-table CAS failures caused by
commits on <em>different</em> tables no longer charge manifest I/O, and only
charge for the CAS conflict. This is why S3 Express at 20+ tables
FA-only jumps from 14.9 to <strong>~36 c/s</strong>: its CAS throughput was already
the binding constraint, and removing the spurious manifest I/O lets
more commits through.</li>
  <li><strong>Timing leaks removed.</strong> The CAS version check and <code class="language-plaintext highlighter-rouge">catalog.read()</code>
both split-yield at half-RTT, eliminating a fast path where clients
could commit against state propagating faster than the full CAS round
trip.</li>
  <li><strong>VO convoy decomposed per-table.</strong> The IO convoy was using a global
value and ignored the per-table configuration. Corrected, multi-table
VO tails are lower.</li>
  <li><strong>GCP scaling is weaker than presented.</strong> With the tighter per-table
bound, 50 tables only reach 0.7 c/s for GCP (was 3.6 c/s in the old
model).</li>
  <li><strong><code class="language-plaintext highlighter-rouge">table_metadata_inlined</code> config drift fixed.</strong> An orphaned template
flag had silently switched intermediate re-runs to the 1/(3L) inlined
bound; the post now uses non-inlined metadata, matching the original
intent.</li>
</ul>

<p>The tier ordering (S3x » S3/Azure Premium/Azure Standard » GCP) is unchanged,
which makes sense given the measured CAS latencies. Adding tables improves
scalability, but less than the original numbers implied, especially at 5–20
tables.</p>

<p>One presentational change: VO latency figures in this post are now reported as
the mean, where the previous version cited VO P99. With the per-table convoy
fix, the mean is a more stable summary of the distribution.</p>

<details>
  <summary>Full correction details (AI generated)</summary>

  <p>Single-table knees at &gt;95% VO success:</p>

  <table>
    <thead>
      <tr>
        <th>Provider</th>
        <th style="text-align: right">Published FA-only</th>
        <th style="text-align: right">Corrected FA-only</th>
        <th style="text-align: right">Published 90/10</th>
        <th style="text-align: right">Corrected 90/10</th>
      </tr>
    </thead>
    <tbody>
      <tr>
        <td>S3 Express</td>
        <td style="text-align: right">14.6 c/s</td>
        <td style="text-align: right">14.6 c/s</td>
        <td style="text-align: right">7.5 c/s</td>
        <td style="text-align: right">7.4 c/s</td>
      </tr>
      <tr>
        <td>S3 Standard</td>
        <td style="text-align: right">2.4 c/s</td>
        <td style="text-align: right"><strong>1.8 c/s</strong></td>
        <td style="text-align: right">1.8 c/s</td>
        <td style="text-align: right">1.8 c/s</td>
      </tr>
      <tr>
        <td>Azure Premium</td>
        <td style="text-align: right">2.5 c/s</td>
        <td style="text-align: right">2.4 c/s</td>
        <td style="text-align: right">1.9 c/s</td>
        <td style="text-align: right">1.8 c/s</td>
      </tr>
      <tr>
        <td>Azure Standard</td>
        <td style="text-align: right">2.4 c/s</td>
        <td style="text-align: right"><strong>1.8 c/s</strong></td>
        <td style="text-align: right">1.5 c/s</td>
        <td style="text-align: right">1.5 c/s</td>
      </tr>
      <tr>
        <td>GCP</td>
        <td style="text-align: right">0.7 c/s</td>
        <td style="text-align: right"><strong>0.4 c/s</strong></td>
        <td style="text-align: right">0.4 c/s</td>
        <td style="text-align: right">0.4 c/s</td>
      </tr>
    </tbody>
  </table>

  <p><strong>The biggest structural change</strong> is the multi-table FA-only knee for
S3 Standard and Azure Premium at 5–20 tables:</p>

  <table>
    <thead>
      <tr>
        <th>Provider</th>
        <th style="text-align: right">Tables</th>
        <th style="text-align: right">Published</th>
        <th style="text-align: right">Corrected</th>
        <th>Δ</th>
      </tr>
    </thead>
    <tbody>
      <tr>
        <td>S3 Standard</td>
        <td style="text-align: right">5–20</td>
        <td style="text-align: right">7.2–7.4 c/s</td>
        <td style="text-align: right"><strong>3.7 c/s</strong></td>
        <td>−50%</td>
      </tr>
      <tr>
        <td>S3 Standard</td>
        <td style="text-align: right">50</td>
        <td style="text-align: right">7.4 c/s</td>
        <td style="text-align: right">7.2 c/s</td>
        <td>−3%</td>
      </tr>
      <tr>
        <td>Azure Premium</td>
        <td style="text-align: right">5–20</td>
        <td style="text-align: right">7.2–7.4 c/s</td>
        <td style="text-align: right">3.7 c/s</td>
        <td>−50%</td>
      </tr>
      <tr>
        <td>Azure Premium</td>
        <td style="text-align: right">50</td>
        <td style="text-align: right">7.4 c/s</td>
        <td style="text-align: right">3.7 c/s</td>
        <td>−50%</td>
      </tr>
      <tr>
        <td>Azure Standard</td>
        <td style="text-align: right">10–50</td>
        <td style="text-align: right">3.7 c/s</td>
        <td style="text-align: right">3.7 c/s</td>
        <td>—</td>
      </tr>
      <tr>
        <td>GCP</td>
        <td style="text-align: right">50</td>
        <td style="text-align: right">3.6 c/s</td>
        <td style="text-align: right"><strong>0.7 c/s</strong></td>
        <td>−81%</td>
      </tr>
      <tr>
        <td>S3 Express</td>
        <td style="text-align: right">50</td>
        <td style="text-align: right">14.9 c/s</td>
        <td style="text-align: right"><strong>36.0 c/s</strong></td>
        <td><strong>+142%</strong> (free-retry for cross-table CAS failures)</td>
      </tr>
    </tbody>
  </table>

  <p>For S3/Azure at 5–20 tables the published numbers were
catalog-CAS-bound at ~7.4 c/s; with the non-inlined per-table ceiling
now at 5.7 c/s, the per-table bound binds first and the knee flattens
to 3.7 c/s. Only at 50 tables does catalog CAS again become the
bottleneck (for S3 Standard FA-only; Azure Premium sits at the
per-table bound through 50 tables).</p>

  <p>S3 Express at 50 tables jumps to 36 c/s because its ~10 ms per-op
latency keeps the per-table bound very high; with the <code class="language-plaintext highlighter-rouge">ec383ff</code>
free-retry fix, cross-table CAS failures no longer charge manifest
I/O, so the catalog handles more commits.</p>

  <p>GCP’s multi-table scaling is weaker than presented: 0.4 c/s
(1 table) to 0.7 c/s (50 tables) FA-only, versus the published
0.7 c/s to 3.6 c/s. The per-op latency is high enough that the
per-table bound binds through 50 tables.</p>

</details>
<p><br /></p>

<h1 id="appendix-a-full-4a4b-results">Appendix A: Full 4a/4b results</h1>
<p><a id="appendix-a"></a></p>

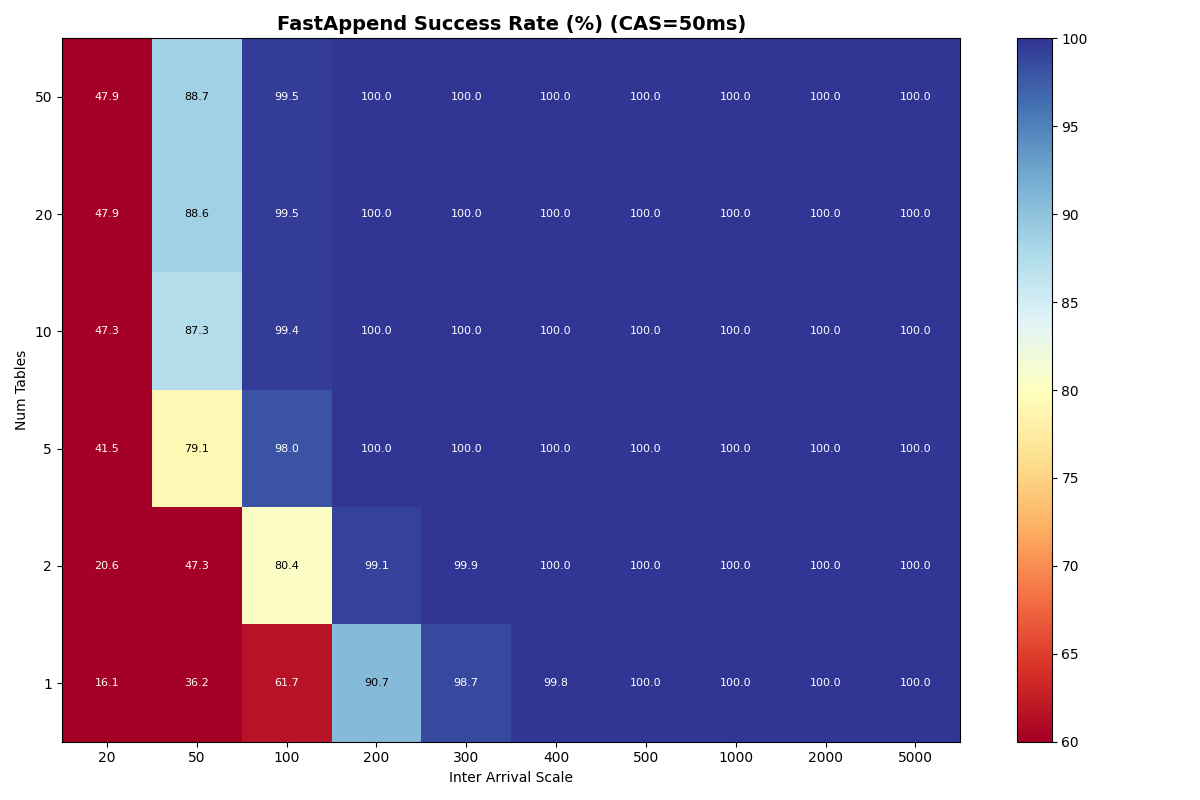
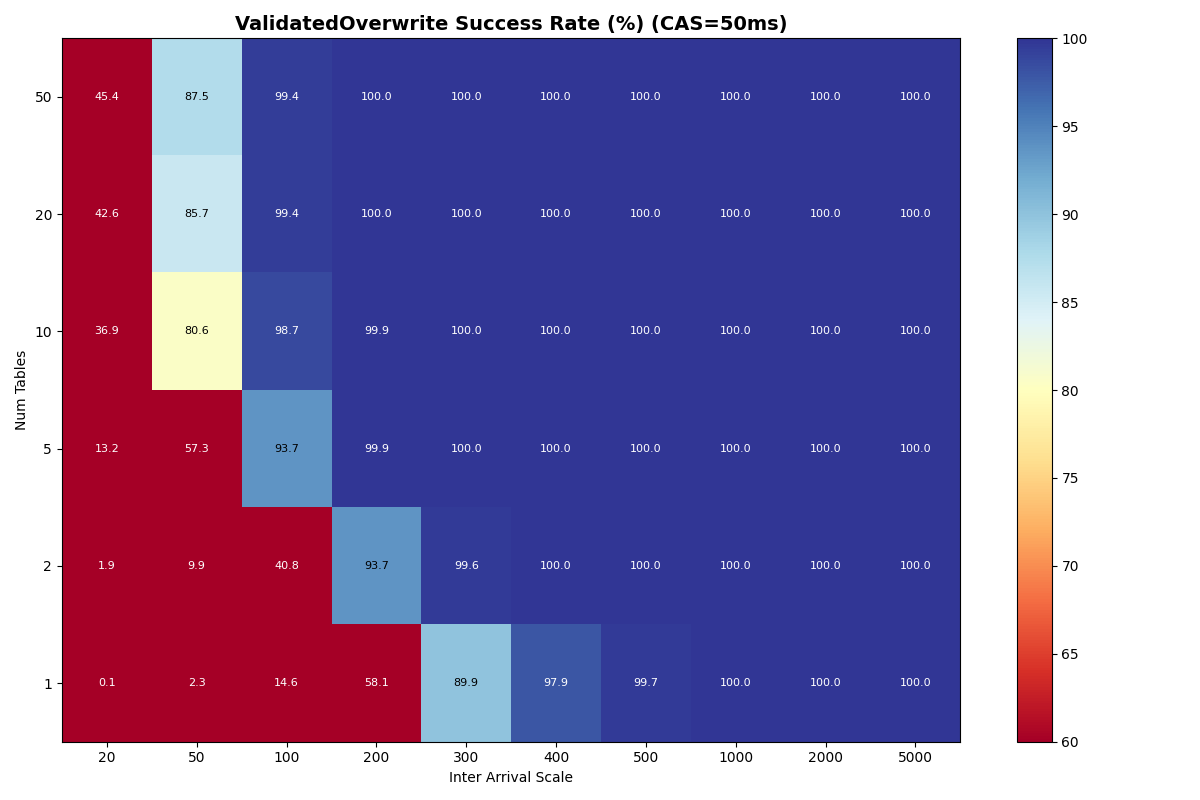
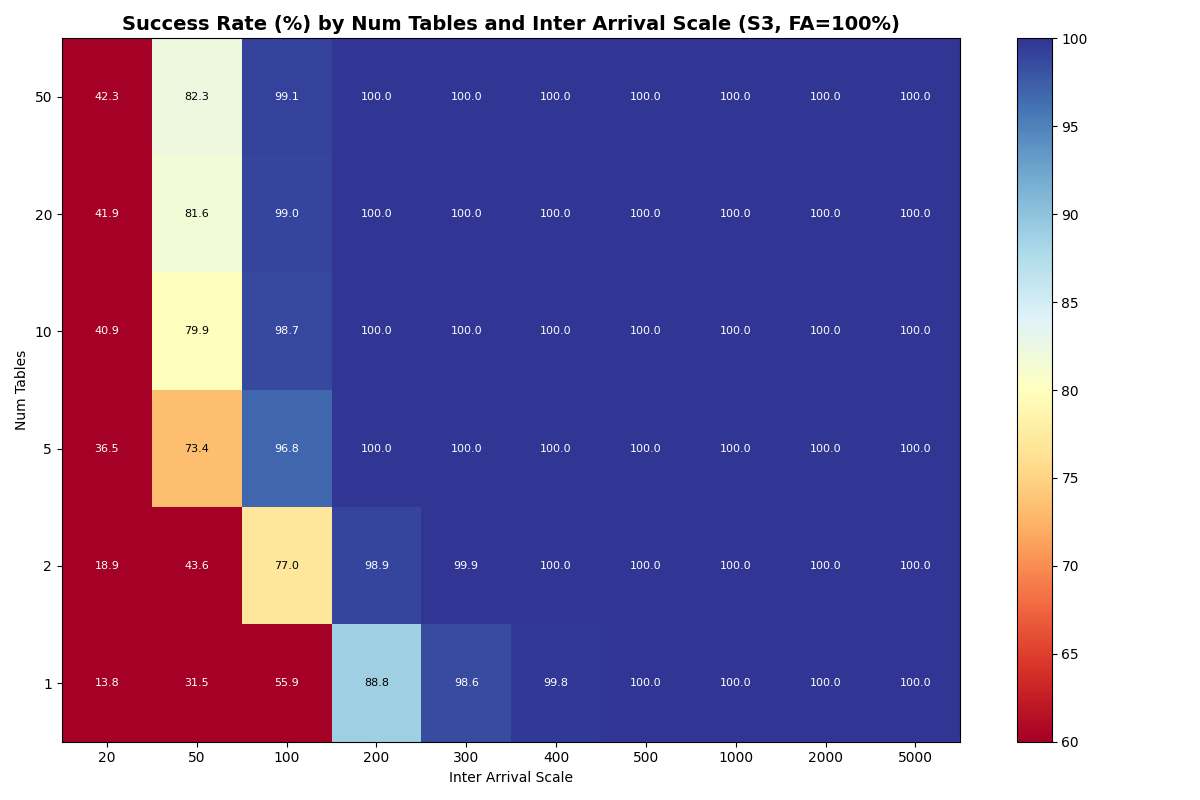
<p>Full heatmaps for experiments 4a (FA-only) and 4b (90/10 FA/VO mix) across
table counts, inter-arrival times, and catalog CAS latencies. Both uniform and
Zipfian table selection distributions are included.</p>

<details>
  <summary>4a: FA-only, uniform (10ms, 1ms CAS)</summary>

  <figure class="half ">


    <a href="/images/2026/03/providercatalog/exp4a_tables_fa/cas_10ms/heatmap_success_rate.png" class="glightbox" data-gallery="exp4a_tables_fa_10ms-exp-4a-fa-success-rate-and-latency-by-table-count-and-inter-arrival-time-10ms-1ms-cas" data-description="Exp 4a: Heatmap of FA success rate by number of tables (1-50) and inter-arrival scale, 10ms CAS. More tables dramatically improve success: 50 tables achieve 69.5% at 20ms inter-arrival vs 13.9% with 1 table. 10+ tables reach 100% at 100ms+ inter-arrival.">
      <img src="/images/2026/03/providercatalog/exp4a_tables_fa/cas_10ms/heatmap_success_rate.png" alt="Exp 4a: Heatmap of FA success rate by number of tables (1-50) and inter-arrival scale, 10ms CAS. More tables dramatically improve success: 50 tables achieve 69.5% at 20ms inter-arrival vs 13.9% with 1 table. 10+ tables reach 100% at 100ms+ inter-arrival." />
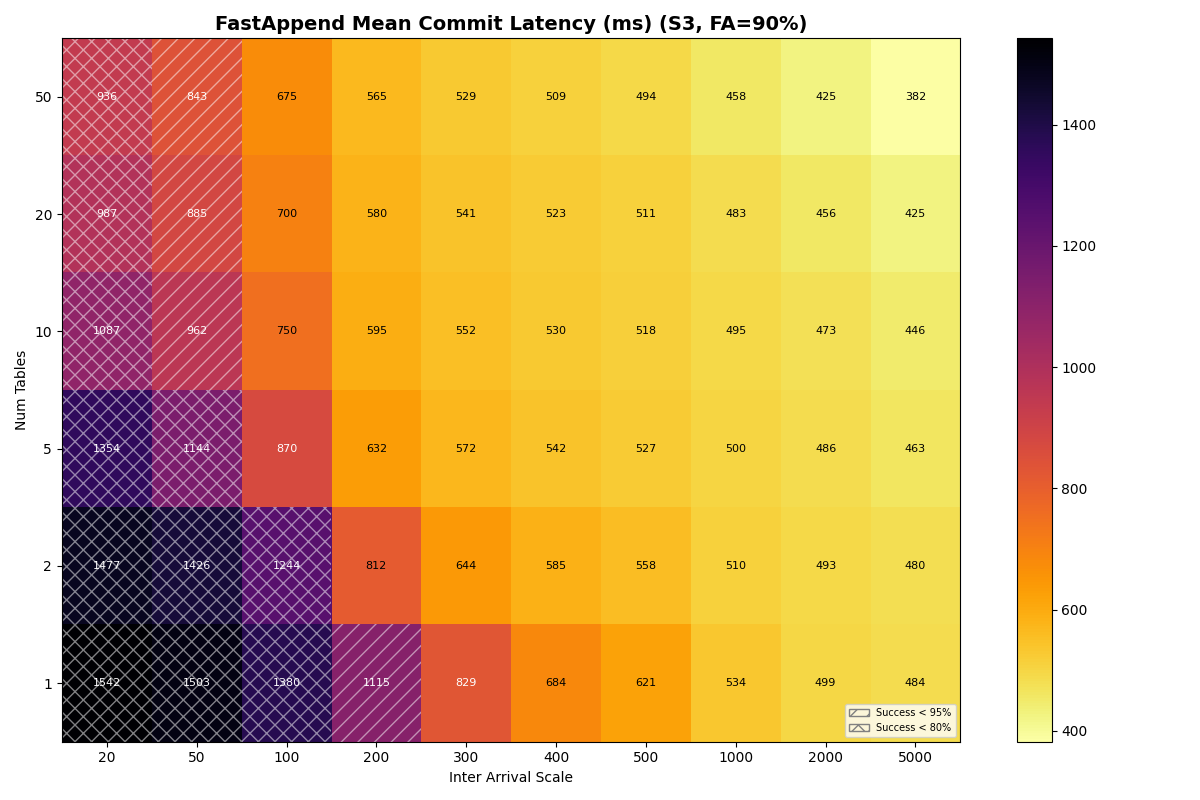
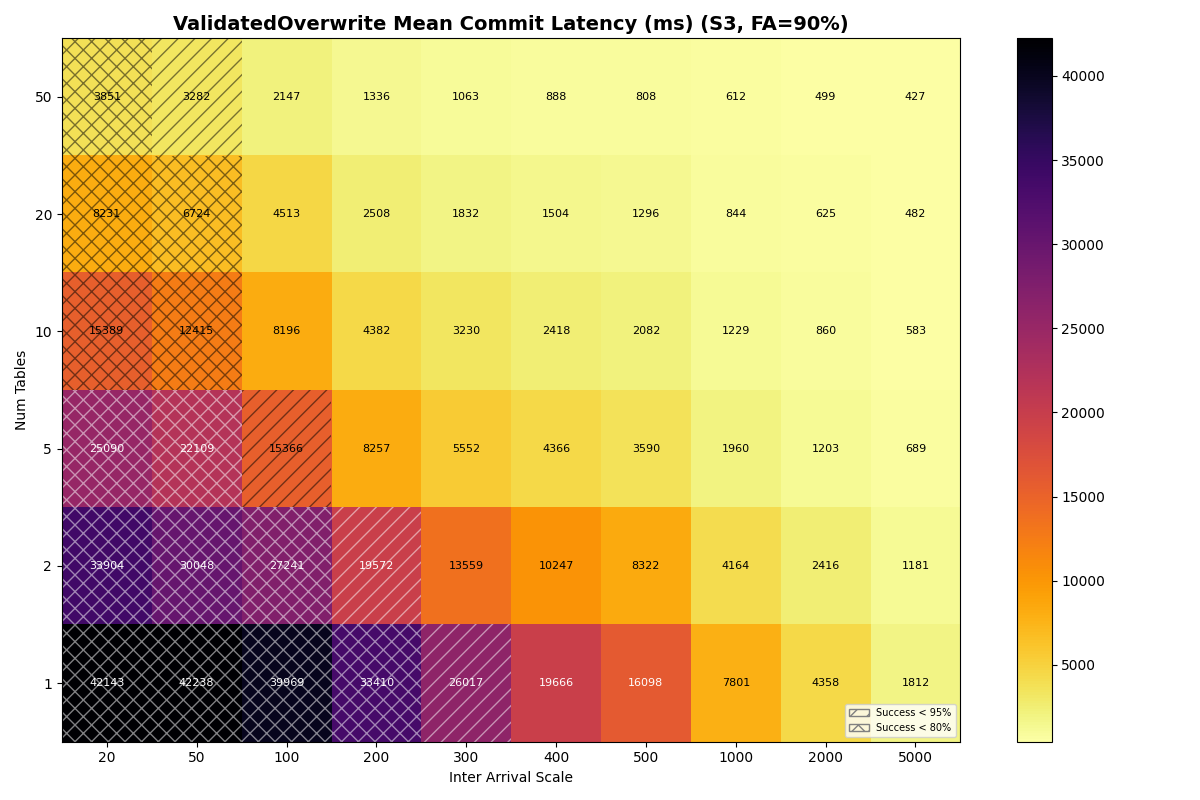
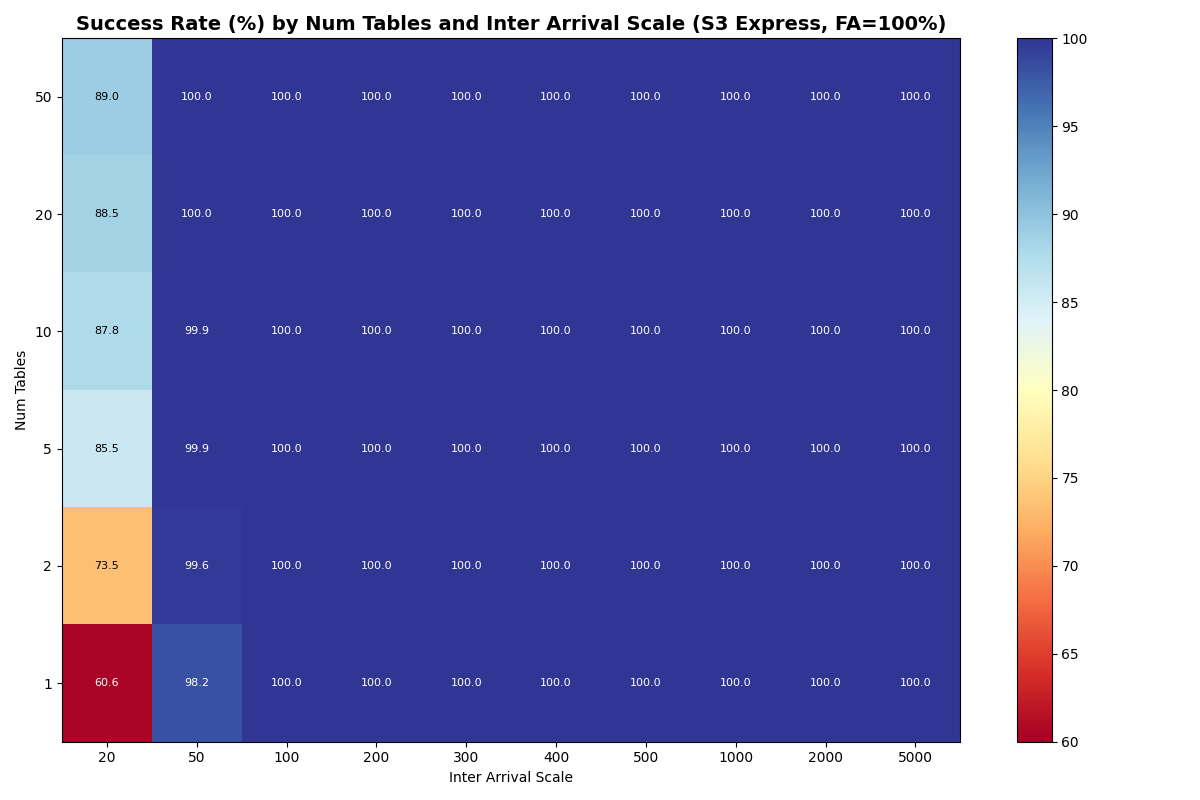
    </a>


    <a href="/images/2026/03/providercatalog/exp4a_tables_fa/cas_10ms/xheatmap_mean_latency.png" class="glightbox" data-gallery="exp4a_tables_fa_10ms-exp-4a-fa-success-rate-and-latency-by-table-count-and-inter-arrival-time-10ms-1ms-cas" data-description="Exp 4a: Heatmap of mean commit latency by table count and inter-arrival scale, 10ms CAS. Latency drops with more tables: 50 tables at 20ms is 701ms vs 1443ms for 1 table. Baseline converges to 338-455ms at 5000ms inter-arrival. Hatched cells indicate low success rates.">
      <img src="/images/2026/03/providercatalog/exp4a_tables_fa/cas_10ms/xheatmap_mean_latency.png" alt="Exp 4a: Heatmap of mean commit latency by table count and inter-arrival scale, 10ms CAS. Latency drops with more tables: 50 tables at 20ms is 701ms vs 1443ms for 1 table. Baseline converges to 338-455ms at 5000ms inter-arrival. Hatched cells indicate low success rates." />
    </a>


    <a href="/images/2026/03/providercatalog/exp4a_tables_fa/cas_10ms/xheatmap_p99_latency.png" class="glightbox" data-gallery="exp4a_tables_fa_10ms-exp-4a-fa-success-rate-and-latency-by-table-count-and-inter-arrival-time-10ms-1ms-cas" data-description="Exp 4a: Heatmap of p99 commit latency by table count and inter-arrival scale, 10ms CAS. 1 table at 20ms reaches 2767ms; 50 tables at 20ms is 1279ms. At low load (5000ms), p99 ranges 593-744ms. Hatched cells in bottom-left indicate low success rates." style="display:none">
    </a>


    <a href="/images/2026/03/providercatalog/exp4a_tables_fa/cas_1ms/heatmap_success_rate.png" class="glightbox" data-gallery="exp4a_tables_fa_10ms-exp-4a-fa-success-rate-and-latency-by-table-count-and-inter-arrival-time-10ms-1ms-cas" data-description="Exp 4a: FA success rate by table count and inter-arrival, 1ms CAS. Similar pattern to 10ms but shifted: 10 tables at 20ms reaches 77.1% (vs 63.5% at 10ms). 20+ tables reach 100% at 100ms. 1 table at 20ms is 14.7%, at 50ms is 33.1%." style="display:none">
    </a>


    <a href="/images/2026/03/providercatalog/exp4a_tables_fa/cas_1ms/xheatmap_mean_latency.png" class="glightbox" data-gallery="exp4a_tables_fa_10ms-exp-4a-fa-success-rate-and-latency-by-table-count-and-inter-arrival-time-10ms-1ms-cas" data-description="Exp 4a: Mean commit latency by table count and inter-arrival, 1ms CAS. 1 table at 20ms is 1347ms, 50 tables at 20ms is 588ms. At 5000ms, 1 table converges to 425ms, 50 tables to 308ms. Lowest latencies of all CAS settings." style="display:none">
    </a>


    <a href="/images/2026/03/providercatalog/exp4a_tables_fa/cas_1ms/xheatmap_p99_latency.png" class="glightbox" data-gallery="exp4a_tables_fa_10ms-exp-4a-fa-success-rate-and-latency-by-table-count-and-inter-arrival-time-10ms-1ms-cas" data-description="Exp 4a: P99 commit latency by table count and inter-arrival, 1ms CAS. 1 table at 20ms is 2585ms, 50 tables at 20ms is 1143ms. At 5000ms, p99 ranges 564-699ms. Much tighter tails than higher CAS latencies." style="display:none">
    </a>


    <figcaption>Exp 4a: FA success rate and latency by table count and inter-arrival time (10ms, 1ms CAS).
</figcaption>
  
</figure>

</details>

<details>
  <summary>4a: FA-only, uniform (50ms, 120ms CAS)</summary>

  <figure class="half ">


    <a href="/images/2026/03/providercatalog/exp4a_tables_fa/cas_50ms/heatmap_success_rate.png" class="glightbox" data-gallery="exp4a_tables_fa_50ms-exp-4a-fa-success-rate-and-latency-by-table-count-50ms-120ms-cas" data-description="Exp 4a: Heatmap of FA success rate by table count and inter-arrival scale, 50ms CAS. Worse than 10ms: 1 table at 20ms is 11.5%, 50 tables at 20ms is only 35.1%. Even 20-50 tables need 200ms+ inter-arrival for 99%+ success.">
      <img src="/images/2026/03/providercatalog/exp4a_tables_fa/cas_50ms/heatmap_success_rate.png" alt="Exp 4a: Heatmap of FA success rate by table count and inter-arrival scale, 50ms CAS. Worse than 10ms: 1 table at 20ms is 11.5%, 50 tables at 20ms is only 35.1%. Even 20-50 tables need 200ms+ inter-arrival for 99%+ success." />
    </a>


    <a href="/images/2026/03/providercatalog/exp4a_tables_fa/cas_50ms/xheatmap_mean_latency.png" class="glightbox" data-gallery="exp4a_tables_fa_50ms-exp-4a-fa-success-rate-and-latency-by-table-count-50ms-120ms-cas" data-description="Exp 4a: Heatmap of mean commit latency by table count and inter-arrival scale, 50ms CAS. Higher baseline than 10ms: 1 table at 5000ms is 578ms vs 455ms. At 20ms, 1 table reaches 1935ms and 50 tables 1218ms. Nearly all low-arrival cells are hatched.">
      <img src="/images/2026/03/providercatalog/exp4a_tables_fa/cas_50ms/xheatmap_mean_latency.png" alt="Exp 4a: Heatmap of mean commit latency by table count and inter-arrival scale, 50ms CAS. Higher baseline than 10ms: 1 table at 5000ms is 578ms vs 455ms. At 20ms, 1 table reaches 1935ms and 50 tables 1218ms. Nearly all low-arrival cells are hatched." />
    </a>


    <a href="/images/2026/03/providercatalog/exp4a_tables_fa/cas_50ms/xheatmap_p99_latency.png" class="glightbox" data-gallery="exp4a_tables_fa_50ms-exp-4a-fa-success-rate-and-latency-by-table-count-50ms-120ms-cas" data-description="Exp 4a: Heatmap of p99 commit latency by table count and inter-arrival scale, 50ms CAS. 1 table at 20ms reaches 3603ms; 50 tables at 20ms is 2049ms. At low load (5000ms), p99 ranges 718-937ms. Wide hatched region covers most of the left half." style="display:none">
    </a>


    <a href="/images/2026/03/providercatalog/exp4a_tables_fa/cas_120ms/heatmap_success_rate.png" class="glightbox" data-gallery="exp4a_tables_fa_50ms-exp-4a-fa-success-rate-and-latency-by-table-count-50ms-120ms-cas" data-description="Exp 4a: Heatmap of FA success rate by table count and inter-arrival scale, 120ms CAS. Severely degraded: even 50 tables at 20ms is only 18.1%. 1 table needs 500ms+ for 98%+ success. Table count provides less relief when CAS is the bottleneck." style="display:none">
    </a>


    <a href="/images/2026/03/providercatalog/exp4a_tables_fa/cas_120ms/xheatmap_mean_latency.png" class="glightbox" data-gallery="exp4a_tables_fa_50ms-exp-4a-fa-success-rate-and-latency-by-table-count-50ms-120ms-cas" data-description="Exp 4a: Heatmap of mean commit latency by table count and inter-arrival scale, 120ms CAS. Very high latencies: 1 table at 20ms is 2757ms, 50 tables at 20ms is 2129ms. Even at 5000ms, baseline is 676-802ms. Nearly all cells are hatched." style="display:none">
    </a>


    <a href="/images/2026/03/providercatalog/exp4a_tables_fa/cas_120ms/xheatmap_p99_latency.png" class="glightbox" data-gallery="exp4a_tables_fa_50ms-exp-4a-fa-success-rate-and-latency-by-table-count-50ms-120ms-cas" data-description="Exp 4a: Heatmap of p99 commit latency by table count and inter-arrival scale, 120ms CAS. Extreme tail latency: 1 table at 20ms reaches 5076ms, 50 tables at 20ms is 3483ms. At 5000ms, p99 is still 1085-1336ms. Nearly all cells are hatched." style="display:none">
    </a>


    <figcaption>Exp 4a: FA success rate and latency by table count (50ms, 120ms CAS).
</figcaption>
  
</figure>

</details>

<details>
  <summary>4a: FA-only, Zipfian (50ms CAS)</summary>

  <figure class="half ">


    <a href="/images/2026/03/providercatalog/exp4a_zipf_tables_fa/cas_50ms/heatmap_success_rate.png" class="glightbox" data-gallery="exp4a_tables_zipf_50ms-exp-4a-fa-success-rate-and-latency-with-zipfian-table-selection-50ms-cas" data-description="Exp 4a: Zipfian FA success rate by table count and inter-arrival, 50ms CAS. Much worse than uniform: 50 tables at 20ms is only 32.3% (vs 35.1% uniform). 10 tables at 100ms is 78.9%. Adding tables beyond 10 barely helps- Zipf 50 tables approximates uniform 5 tables.">
      <img src="/images/2026/03/providercatalog/exp4a_zipf_tables_fa/cas_50ms/heatmap_success_rate.png" alt="Exp 4a: Zipfian FA success rate by table count and inter-arrival, 50ms CAS. Much worse than uniform: 50 tables at 20ms is only 32.3% (vs 35.1% uniform). 10 tables at 100ms is 78.9%. Adding tables beyond 10 barely helps- Zipf 50 tables approximates uniform 5 tables." />
    </a>


    <a href="/images/2026/03/providercatalog/exp4a_zipf_tables_fa/cas_50ms/conflict_type_by_table_t50_s100.png" class="glightbox" data-gallery="exp4a_tables_zipf_50ms-exp-4a-fa-success-rate-and-latency-with-zipfian-table-selection-50ms-cas" data-description="Exp 4a: Conflict type breakdown by table rank at 50 tables, ias=100ms, Zipf 50ms CAS. Rank-1 table dominates with ~44% of writes and mostly same-table (tblptn) conflicts. Cold tables (rank 10+) have more catalog conflicts than table conflicts.">
      <img src="/images/2026/03/providercatalog/exp4a_zipf_tables_fa/cas_50ms/conflict_type_by_table_t50_s100.png" alt="Exp 4a: Conflict type breakdown by table rank at 50 tables, ias=100ms, Zipf 50ms CAS. Rank-1 table dominates with ~44% of writes and mostly same-table (tblptn) conflicts. Cold tables (rank 10+) have more catalog conflicts than table conflicts." />
    </a>


    <a href="/images/2026/03/providercatalog/exp4a_zipf_tables_fa/cas_50ms/xheatmap_mean_latency.png" class="glightbox" data-gallery="exp4a_tables_zipf_50ms-exp-4a-fa-success-rate-and-latency-with-zipfian-table-selection-50ms-cas" data-description="Exp 4a: Zipfian mean commit latency by table count and inter-arrival, 50ms CAS. 1 table at 20ms is 1928ms, 50 tables is 1384ms. At 5000ms, baseline is 525-579ms. Gap between table counts is smaller than uniform because the hot table dominates." style="display:none">
    </a>


    <a href="/images/2026/03/providercatalog/exp4a_zipf_tables_fa/cas_50ms/xheatmap_p99_latency.png" class="glightbox" data-gallery="exp4a_tables_zipf_50ms-exp-4a-fa-success-rate-and-latency-with-zipfian-table-selection-50ms-cas" data-description="Exp 4a: Zipfian p99 commit latency by table count and inter-arrival, 50ms CAS. 1 table at 20ms is 3615ms, 50 tables is 2801ms. At 5000ms, p99 ranges 811-961ms. Tails are worse than uniform because the hot table sees concentrated contention." style="display:none">
    </a>


    <figcaption>Exp 4a: FA success rate and latency with Zipfian table selection (50ms CAS).
</figcaption>
  
</figure>

</details>

<details>
  <summary>4b: 90/10 FA/VO mix, uniform (10ms, 1ms CAS)</summary>

  <figure class="half ">


    <a href="/images/2026/03/providercatalog/exp4b_tables_mix/cas_10ms/heatmap_fa_success_rate.png" class="glightbox" data-gallery="exp4b_tables_mix_10ms_success-exp-4b-fa-and-vo-success-rates-90-10-mix-10ms-and-1ms-cas" data-description="Exp 4b: Heatmap of FA success rate (90/10 FA/VO mix) by table count and inter-arrival scale, 10ms CAS. Similar to exp4a FA-only: 50 tables at 20ms is 69.4%, 1 table at 20ms is 13.8%. VO presence barely affects FA success.">
      <img src="/images/2026/03/providercatalog/exp4b_tables_mix/cas_10ms/heatmap_fa_success_rate.png" alt="Exp 4b: Heatmap of FA success rate (90/10 FA/VO mix) by table count and inter-arrival scale, 10ms CAS. Similar to exp4a FA-only: 50 tables at 20ms is 69.4%, 1 table at 20ms is 13.8%. VO presence barely affects FA success." />
    </a>


    <a href="/images/2026/03/providercatalog/exp4b_tables_mix/cas_10ms/heatmap_vo_success_rate.png" class="glightbox" data-gallery="exp4b_tables_mix_10ms_success-exp-4b-fa-and-vo-success-rates-90-10-mix-10ms-and-1ms-cas" data-description="Exp 4b: Heatmap of VO success rate (90/10 FA/VO mix) by table count and inter-arrival scale, 10ms CAS. VO benefits from table partitioning: 1 table at 20ms is near-zero, 50 tables at 20ms tracks FA closely. 10 tables at 100ms reaches 99%+; more tables nearly eliminate the VO disadvantage. VO converges to FA success rates with enough tables.">
      <img src="/images/2026/03/providercatalog/exp4b_tables_mix/cas_10ms/heatmap_vo_success_rate.png" alt="Exp 4b: Heatmap of VO success rate (90/10 FA/VO mix) by table count and inter-arrival scale, 10ms CAS. VO benefits from table partitioning: 1 table at 20ms is near-zero, 50 tables at 20ms tracks FA closely. 10 tables at 100ms reaches 99%+; more tables nearly eliminate the VO disadvantage. VO converges to FA success rates with enough tables." />
    </a>


    <a href="/images/2026/03/providercatalog/exp4b_tables_mix/cas_10ms/xheatmap_fa_mean_latency.png" class="glightbox" data-gallery="exp4b_tables_mix_10ms_success-exp-4b-fa-and-vo-success-rates-90-10-mix-10ms-and-1ms-cas" data-description="Exp 4b: FA mean commit latency (90/10 mix) by table count and inter-arrival, 10ms CAS. Similar pattern to exp4a: 50 tables at 5000ms is ~341ms, 1 table at 20ms is ~2256ms. Hatched cells in the lower-left indicate low success rates." style="display:none">
    </a>


    <a href="/images/2026/03/providercatalog/exp4b_tables_mix/cas_10ms/xheatmap_vo_mean_latency.png" class="glightbox" data-gallery="exp4b_tables_mix_10ms_success-exp-4b-fa-and-vo-success-rates-90-10-mix-10ms-and-1ms-cas" data-description="Exp 4b: VO mean commit latency (90/10 mix) by table count and inter-arrival, 10ms CAS. VO latency is higher than FA but manageable with multiple tables: 50 tables at 50ms is ~878ms, at 5000ms is ~341ms. 1 table at 200ms peaks at ~3838ms. Hatched cells in the left region indicate low success rates." style="display:none">
    </a>


    <a href="/images/2026/03/providercatalog/exp4b_tables_mix/cas_1ms/heatmap_fa_success_rate.png" class="glightbox" data-gallery="exp4b_tables_mix_10ms_success-exp-4b-fa-and-vo-success-rates-90-10-mix-10ms-and-1ms-cas" data-description="Exp 4b: FA success rate (90/10 mix) by table count and inter-arrival, 1ms CAS. Nearly identical to exp4a FA-only: 10 tables at 50ms is 99.0%, 20+ tables are 100% from 50ms. 1 table at 20ms is 14.6%. VO presence barely affects FA success." style="display:none">
    </a>


    <a href="/images/2026/03/providercatalog/exp4b_tables_mix/cas_1ms/heatmap_vo_success_rate.png" class="glightbox" data-gallery="exp4b_tables_mix_10ms_success-exp-4b-fa-and-vo-success-rates-90-10-mix-10ms-and-1ms-cas" data-description="Exp 4b: VO success rate (90/10 mix) by table count and inter-arrival, 1ms CAS. VO benefits strongly from table partitioning: 50 tables at 50ms is ~99.8%, 10 tables at 50ms is ~99%. 1 table at 20ms is near-zero. More tables nearly eliminate the VO disadvantage." style="display:none">
    </a>


    <a href="/images/2026/03/providercatalog/exp4b_tables_mix/cas_1ms/xheatmap_fa_mean_latency.png" class="glightbox" data-gallery="exp4b_tables_mix_10ms_success-exp-4b-fa-and-vo-success-rates-90-10-mix-10ms-and-1ms-cas" data-description="Exp 4b: FA mean commit latency (90/10 mix) by table count and inter-arrival, 1ms CAS. Lowest baseline of all CAS settings: 1 table at 20ms is ~2225ms, 50 tables at 5000ms is ~306ms. Pattern matches exp4a FA-only closely." style="display:none">
    </a>


    <a href="/images/2026/03/providercatalog/exp4b_tables_mix/cas_1ms/xheatmap_vo_mean_latency.png" class="glightbox" data-gallery="exp4b_tables_mix_10ms_success-exp-4b-fa-and-vo-success-rates-90-10-mix-10ms-and-1ms-cas" data-description="Exp 4b: VO mean commit latency (90/10 mix) by table count and inter-arrival, 1ms CAS. VO latency moderate with table partitioning: at 5000ms, ranges from ~547ms (1 table) to ~306ms (50 tables). Fast CAS helps VO when combined with table partitioning. Hatched cells at low inter-arrival for 1-5 tables." style="display:none">
    </a>


    <figcaption>Exp 4b: FA and VO success rates (90/10 mix, 10ms and 1ms CAS).
</figcaption>
  
</figure>

</details>

<details>
  <summary>4b: 90/10 FA/VO mix, uniform (50ms, 120ms CAS)</summary>

  <figure class="half ">


    <a href="/images/2026/03/providercatalog/exp4b_tables_mix/cas_50ms/heatmap_fa_success_rate.png" class="glightbox" data-gallery="exp4b_tables_mix_50ms_success-exp-4b-fa-and-vo-success-rates-90-10-mix-50ms-and-120ms-cas" data-description="Exp 4b: Heatmap of FA success rate (90/10 mix) by table count and inter-arrival scale, 50ms CAS. 1 table at 20ms is 11.4%, 50 tables at 20ms is 35.1%. At 100ms, 50 tables reach 95.5%, 1 table is 47.0%.">
      <img src="/images/2026/03/providercatalog/exp4b_tables_mix/cas_50ms/heatmap_fa_success_rate.png" alt="Exp 4b: Heatmap of FA success rate (90/10 mix) by table count and inter-arrival scale, 50ms CAS. 1 table at 20ms is 11.4%, 50 tables at 20ms is 35.1%. At 100ms, 50 tables reach 95.5%, 1 table is 47.0%." />
    </a>


    <a href="/images/2026/03/providercatalog/exp4b_tables_mix/cas_50ms/heatmap_vo_success_rate.png" class="glightbox" data-gallery="exp4b_tables_mix_50ms_success-exp-4b-fa-and-vo-success-rates-90-10-mix-50ms-and-120ms-cas" data-description="Exp 4b: Heatmap of VO success rate (90/10 mix) by table count and inter-arrival, 50ms CAS. VO improves substantially with table count: 50 tables at 100ms approaches ~95%, 10 tables at 50ms ~69%. 1 table at 100ms is ~47%, 50 tables at 20ms ~35%. FA and VO converge at high table counts.">
      <img src="/images/2026/03/providercatalog/exp4b_tables_mix/cas_50ms/heatmap_vo_success_rate.png" alt="Exp 4b: Heatmap of VO success rate (90/10 mix) by table count and inter-arrival, 50ms CAS. VO improves substantially with table count: 50 tables at 100ms approaches ~95%, 10 tables at 50ms ~69%. 1 table at 100ms is ~47%, 50 tables at 20ms ~35%. FA and VO converge at high table counts." />
    </a>


    <a href="/images/2026/03/providercatalog/exp4b_tables_mix/cas_120ms/heatmap_fa_success_rate.png" class="glightbox" data-gallery="exp4b_tables_mix_50ms_success-exp-4b-fa-and-vo-success-rates-90-10-mix-50ms-and-120ms-cas" data-description="Exp 4b: Heatmap of FA success rate (90/10 mix) by table count and inter-arrival, 120ms CAS. Further degraded: 1 table at 100ms is 38.5%, 50 tables at 20ms is 18.1%. 50 tables reach 100% by 500ms inter-arrival." style="display:none">
    </a>


    <a href="/images/2026/03/providercatalog/exp4b_tables_mix/cas_120ms/heatmap_vo_success_rate.png" class="glightbox" data-gallery="exp4b_tables_mix_50ms_success-exp-4b-fa-and-vo-success-rates-90-10-mix-50ms-and-120ms-cas" data-description="Exp 4b: Heatmap of VO success rate (90/10 mix) by table count and inter-arrival, 120ms CAS. 1 table at 100ms is ~38%, 200ms is ~66%. 50 tables at 100ms is ~73%, 50 tables at 20ms is ~18%. FA and VO converge at high table counts, both limited by CAS latency." style="display:none">
    </a>


    <figcaption>Exp 4b: FA and VO success rates (90/10 mix, 50ms and 120ms CAS).
</figcaption>
  
</figure>

</details>

<details>
  <summary>4b: 90/10 FA/VO mix, Zipfian (50ms CAS)</summary>

  <figure class="half ">


    <a href="/images/2026/03/providercatalog/exp4b_zipf_tables_mix/cas_50ms/heatmap_vo_success_rate.png" class="glightbox" data-gallery="exp4b_tables_zipf_50ms-exp-4b-vo-success-rate-and-conflict-type-distribution-with-zipfian-table-selection-50ms-cas" data-description="Exp 4b: Zipfian VO success rate (90/10 mix) by table count and inter-arrival, 50ms CAS. VO benefits from table partitioning but less than uniform: 50 tables at 100ms reaches ~75%, 10 tables at 100ms ~68%. 1 table at 100ms is ~47%. The hot table concentrates per-table conflicts, limiting the benefit of additional tables.">
      <img src="/images/2026/03/providercatalog/exp4b_zipf_tables_mix/cas_50ms/heatmap_vo_success_rate.png" alt="Exp 4b: Zipfian VO success rate (90/10 mix) by table count and inter-arrival, 50ms CAS. VO benefits from table partitioning but less than uniform: 50 tables at 100ms reaches ~75%, 10 tables at 100ms ~68%. 1 table at 100ms is ~47%. The hot table concentrates per-table conflicts, limiting the benefit of additional tables." />
    </a>


    <a href="/images/2026/03/providercatalog/exp4b_zipf_tables_mix/cas_50ms/conflict_type_by_table_t50_s100.png" class="glightbox" data-gallery="exp4b_tables_zipf_50ms-exp-4b-vo-success-rate-and-conflict-type-distribution-with-zipfian-table-selection-50ms-cas" data-description="Exp 4b: Conflict type breakdown by table rank at 50 tables, ias=100ms, Zipf 50ms CAS, 90/10 mix. Rank-1 table dominates with ~4.7 FA table/partition conflicts per transaction and ~2.4 catalog conflicts uniformly across ranks. Cold tables (rank 10+) have mostly catalog conflicts.">
      <img src="/images/2026/03/providercatalog/exp4b_zipf_tables_mix/cas_50ms/conflict_type_by_table_t50_s100.png" alt="Exp 4b: Conflict type breakdown by table rank at 50 tables, ias=100ms, Zipf 50ms CAS, 90/10 mix. Rank-1 table dominates with ~4.7 FA table/partition conflicts per transaction and ~2.4 catalog conflicts uniformly across ranks. Cold tables (rank 10+) have mostly catalog conflicts." />
    </a>


    <a href="/images/2026/03/providercatalog/exp4b_zipf_tables_mix/cas_50ms/heatmap_fa_success_rate.png" class="glightbox" data-gallery="exp4b_tables_zipf_50ms-exp-4b-vo-success-rate-and-conflict-type-distribution-with-zipfian-table-selection-50ms-cas" data-description="Exp 4b: Zipfian FA success rate (90/10 mix) by table count and inter-arrival, 50ms CAS. Similar to exp4a Zipf FA-only: 50 tables at 100ms reaches ~82%, 10 tables at 100ms ~79%. FA success is insensitive to VO in the mix." style="display:none">
    </a>


    <a href="/images/2026/03/providercatalog/exp4b_zipf_tables_mix/cas_50ms/xheatmap_fa_mean_latency.png" class="glightbox" data-gallery="exp4b_tables_zipf_50ms-exp-4b-vo-success-rate-and-conflict-type-distribution-with-zipfian-table-selection-50ms-cas" data-description="Exp 4b: Zipfian FA mean latency (90/10 mix) by table count and inter-arrival, 50ms CAS. 1 table at 5000ms is ~579ms, 1 table at 20ms is ~1928ms. 50 tables at 5000ms is ~525ms. Pattern similar to exp4a Zipf." style="display:none">
    </a>


    <a href="/images/2026/03/providercatalog/exp4b_zipf_tables_mix/cas_50ms/xheatmap_vo_mean_latency.png" class="glightbox" data-gallery="exp4b_tables_zipf_50ms-exp-4b-vo-success-rate-and-conflict-type-distribution-with-zipfian-table-selection-50ms-cas" data-description="Exp 4b: Zipfian VO mean latency (90/10 mix) by table count and inter-arrival, 50ms CAS. VO latency at moderate load remains in the multi-second range even with many tables. At 5000ms, latencies approach ~500ms baseline; at high load, 1 table peaks at tens of seconds. Hatched cells in lower-left indicate low success rates." style="display:none">
    </a>


    <a href="/images/2026/03/providercatalog/exp4b_zipf_tables_mix/cas_120ms/heatmap_vo_success_rate.png" class="glightbox" data-gallery="exp4b_tables_zipf_50ms-exp-4b-vo-success-rate-and-conflict-type-distribution-with-zipfian-table-selection-50ms-cas" data-description="Exp 4b: Zipfian VO success rate (90/10 mix) by table count and inter-arrival, 120ms CAS. 50 tables at 200ms reaches the mid-90s, 50 tables at 100ms ~57%. 1 table at 200ms is in the 60s. High CAS latency limits VO viability, especially for single tables." style="display:none">
    </a>


    <a href="/images/2026/03/providercatalog/exp4b_zipf_tables_mix/cas_120ms/xheatmap_vo_mean_latency.png" class="glightbox" data-gallery="exp4b_tables_zipf_50ms-exp-4b-vo-success-rate-and-conflict-type-distribution-with-zipfian-table-selection-50ms-cas" data-description="Exp 4b: Zipfian VO mean latency (90/10 mix) by table count and inter-arrival, 120ms CAS. VO latency at 120ms CAS under Zipf is high: at 5000ms, baseline approaches ~1 second; at high load, peaks in the tens of seconds. Most left-region cells are hatched." style="display:none">
    </a>


    <figcaption>Exp 4b: VO success rate and conflict type distribution with Zipfian table selection (50ms CAS).
</figcaption>
  
</figure>

</details>
<p><br /></p>

<h1 id="appendix-b-full-4c-results">Appendix B: Full 4c results</h1>
<p><a id="appendix-b"></a></p>

<p>Galleries of success rate and latency heatmaps for all 5 storage providers,
across all table counts, inter-arrival times, and workload mixes. Click on an
image to view the gallery and flip through them.</p>

<details>
  <summary>S3</summary>

  <figure class="half ">


    <a href="/images/2026/03/providercatalog/exp4c_tables_providers/s3_fa100/heatmap_success_rate.png" class="glightbox" data-gallery="exp4c_tables_s3_success-exp-4c-s3-standard-success-rates-heatmaps-for-fa-100-fa-90-fa-and-vo-and-fa-50-fa-and-vo-across-table-counts-and-inter-arrival-times" data-description="Exp 4c: S3 FA=100% success rate. 1 table at 20ms is 11.6%, 50 tables is 37.1%. Reaches 100% by 500ms for 2+ tables. Very similar profile to standard Azure.">
      <img src="/images/2026/03/providercatalog/exp4c_tables_providers/s3_fa100/heatmap_success_rate.png" alt="Exp 4c: S3 FA=100% success rate. 1 table at 20ms is 11.6%, 50 tables is 37.1%. Reaches 100% by 500ms for 2+ tables. Very similar profile to standard Azure." />
    </a>


    <a href="/images/2026/03/providercatalog/exp4c_tables_providers/s3_fa90/heatmap_fa_success_rate.png" class="glightbox" data-gallery="exp4c_tables_s3_success-exp-4c-s3-standard-success-rates-heatmaps-for-fa-100-fa-90-fa-and-vo-and-fa-50-fa-and-vo-across-table-counts-and-inter-arrival-times" data-description="Exp 4c: S3 FA=90% FastAppend success rate. 1 table at 20ms is 12.6%, 50 tables is 37.2%. At 100ms, 50 tables reach 96.1%. Similar to Azure at high table counts.">
      <img src="/images/2026/03/providercatalog/exp4c_tables_providers/s3_fa90/heatmap_fa_success_rate.png" alt="Exp 4c: S3 FA=90% FastAppend success rate. 1 table at 20ms is 12.6%, 50 tables is 37.2%. At 100ms, 50 tables reach 96.1%. Similar to Azure at high table counts." />
    </a>


    <a href="/images/2026/03/providercatalog/exp4c_tables_providers/s3_fa90/heatmap_vo_success_rate.png" class="glightbox" data-gallery="exp4c_tables_s3_success-exp-4c-s3-standard-success-rates-heatmaps-for-fa-100-fa-90-fa-and-vo-and-fa-50-fa-and-vo-across-table-counts-and-inter-arrival-times" data-description="Exp 4c: S3 FA=90% VO success rate. VO benefits from table partitioning: 1 table at 20ms is 2.0%, 50 tables is 35.7%. At 100ms, 50 tables reach 95.9%. 1 table at 200ms is 61.9%." style="display:none">
    </a>


    <a href="/images/2026/03/providercatalog/exp4c_tables_providers/s3_fa50/heatmap_fa_success_rate.png" class="glightbox" data-gallery="exp4c_tables_s3_success-exp-4c-s3-standard-success-rates-heatmaps-for-fa-100-fa-90-fa-and-vo-and-fa-50-fa-and-vo-across-table-counts-and-inter-arrival-times" data-description="Exp 4c: S3 FA=50% FastAppend success rate. 1 table at 20ms is 18.4%, 50 tables is 37.9%. At 50ms, 50 tables reach 73.6%. FA and VO converge at high table counts." style="display:none">
    </a>


    <a href="/images/2026/03/providercatalog/exp4c_tables_providers/s3_fa50/heatmap_vo_success_rate.png" class="glightbox" data-gallery="exp4c_tables_s3_success-exp-4c-s3-standard-success-rates-heatmaps-for-fa-100-fa-90-fa-and-vo-and-fa-50-fa-and-vo-across-table-counts-and-inter-arrival-times" data-description="Exp 4c: S3 FA=50% VO success rate. 1 table at 100ms is 32.1%, 50 tables at 100ms is 96.0%. At 200ms, 1 table reaches 68.0%. FA and VO success rates converge at high table counts." style="display:none">
    </a>


    <figcaption>Exp 4c: S3 Standard success rates. Heatmaps for FA=100%, FA=90% (FA and VO), and FA=50% (FA and VO) across table counts and inter-arrival times.
</figcaption>
  
</figure>

  <figure class="half ">


    <a href="/images/2026/03/providercatalog/exp4c_tables_providers/s3_fa90/xheatmap_fa_mean_latency.png" class="glightbox" data-gallery="exp4c_tables_s3_latency-exp-4c-s3-standard-commit-latency-fa-vo-mean-latency-heatmaps-for-fa-90-and-fa-50-mixes-hatched-cells-indicate-low-success-rates" data-description="Exp 4c: S3 FA=90% FastAppend mean latency. 1 table at 5000ms is ~713ms, 50 tables at 5000ms is ~484ms. At 20ms inter-arrival, latencies range ~1482-1899ms for 20-50 tables. Hatched cells cover the left portion.">
      <img src="/images/2026/03/providercatalog/exp4c_tables_providers/s3_fa90/xheatmap_fa_mean_latency.png" alt="Exp 4c: S3 FA=90% FastAppend mean latency. 1 table at 5000ms is ~713ms, 50 tables at 5000ms is ~484ms. At 20ms inter-arrival, latencies range ~1482-1899ms for 20-50 tables. Hatched cells cover the left portion." />
    </a>


    <a href="/images/2026/03/providercatalog/exp4c_tables_providers/s3_fa90/xheatmap_vo_mean_latency.png" class="glightbox" data-gallery="exp4c_tables_s3_latency-exp-4c-s3-standard-commit-latency-fa-vo-mean-latency-heatmaps-for-fa-90-and-fa-50-mixes-hatched-cells-indicate-low-success-rates" data-description="Exp 4c: S3 FA=90% ValidatedOverwrite mean latency. VO latency higher than FA but benefits from table partitioning: at 5000ms, ranges from ~713ms (1 table) down to ~484ms (50 tables). Hatched cells in the left region indicate low success rates.">
      <img src="/images/2026/03/providercatalog/exp4c_tables_providers/s3_fa90/xheatmap_vo_mean_latency.png" alt="Exp 4c: S3 FA=90% ValidatedOverwrite mean latency. VO latency higher than FA but benefits from table partitioning: at 5000ms, ranges from ~713ms (1 table) down to ~484ms (50 tables). Hatched cells in the left region indicate low success rates." />
    </a>


    <a href="/images/2026/03/providercatalog/exp4c_tables_providers/s3_fa50/xheatmap_fa_mean_latency.png" class="glightbox" data-gallery="exp4c_tables_s3_latency-exp-4c-s3-standard-commit-latency-fa-vo-mean-latency-heatmaps-for-fa-90-and-fa-50-mixes-hatched-cells-indicate-low-success-rates" data-description="Exp 4c: S3 FA=50% FastAppend mean latency. 1 table at 5000ms is ~1347ms, 50 tables at 5000ms is ~495ms. At 20ms, latencies for 20-50 tables range ~2466-4316ms. Hatched cells cover the left portion." style="display:none">
    </a>


    <a href="/images/2026/03/providercatalog/exp4c_tables_providers/s3_fa50/xheatmap_vo_mean_latency.png" class="glightbox" data-gallery="exp4c_tables_s3_latency-exp-4c-s3-standard-commit-latency-fa-vo-mean-latency-heatmaps-for-fa-90-and-fa-50-mixes-hatched-cells-indicate-low-success-rates" data-description="Exp 4c: S3 FA=50% ValidatedOverwrite mean latency. VO latency higher than FA: at 5000ms, ranges from ~1347ms (1 table) to ~495ms (50 tables). Hatched cells cover the left portion. Higher VO fraction increases retry overhead." style="display:none">
    </a>


    <figcaption>Exp 4c: S3 Standard commit latency. FA/VO mean latency heatmaps for FA=90% and FA=50% mixes. Hatched cells indicate low success rates.
</figcaption>
  
</figure>

</details>

<details>
  <summary>S3 Express One Zone</summary>

  <figure class="half ">


    <a href="/images/2026/03/providercatalog/exp4c_tables_providers/s3x_fa100/heatmap_success_rate.png" class="glightbox" data-gallery="exp4c_tables_s3x_success-exp-4c-s3-express-success-rates-heatmaps-for-fa-100-fa-90-fa-and-vo-and-fa-50-fa-and-vo-across-table-counts-and-inter-arrival-times" data-description="Exp 4c: S3 Express FA=100% success rate. Dramatically better than all other providers. 1 table at 20ms is 66.1%, 50 tables is 96.9%. Only degradation is at 20ms; 50ms+ is 98%+ everywhere.">
      <img src="/images/2026/03/providercatalog/exp4c_tables_providers/s3x_fa100/heatmap_success_rate.png" alt="Exp 4c: S3 Express FA=100% success rate. Dramatically better than all other providers. 1 table at 20ms is 66.1%, 50 tables is 96.9%. Only degradation is at 20ms; 50ms+ is 98%+ everywhere." />
    </a>


    <a href="/images/2026/03/providercatalog/exp4c_tables_providers/s3x_fa90/heatmap_fa_success_rate.png" class="glightbox" data-gallery="exp4c_tables_s3x_success-exp-4c-s3-express-success-rates-heatmaps-for-fa-100-fa-90-fa-and-vo-and-fa-50-fa-and-vo-across-table-counts-and-inter-arrival-times" data-description="Exp 4c: S3 Express FA=90% FastAppend success rate. Nearly perfect: 1 table at 20ms is 65.4%, 50 tables at 20ms is 96.9%. At 50ms+, all configurations reach 97.7%+. Only the 20ms column shows any degradation.">
      <img src="/images/2026/03/providercatalog/exp4c_tables_providers/s3x_fa90/heatmap_fa_success_rate.png" alt="Exp 4c: S3 Express FA=90% FastAppend success rate. Nearly perfect: 1 table at 20ms is 65.4%, 50 tables at 20ms is 96.9%. At 50ms+, all configurations reach 97.7%+. Only the 20ms column shows any degradation." />
    </a>


    <a href="/images/2026/03/providercatalog/exp4c_tables_providers/s3x_fa90/heatmap_vo_success_rate.png" class="glightbox" data-gallery="exp4c_tables_s3x_success-exp-4c-s3-express-success-rates-heatmaps-for-fa-100-fa-90-fa-and-vo-and-fa-50-fa-and-vo-across-table-counts-and-inter-arrival-times" data-description="Exp 4c: S3 Express FA=90% VO success rate. Much better than other providers: 1 table at 20ms is 41.9%, 50 tables is 96.4%. At 50ms, all rows reach 94.7%+. VO nearly matches FA success rates across the board." style="display:none">
    </a>


    <a href="/images/2026/03/providercatalog/exp4c_tables_providers/s3x_fa50/heatmap_fa_success_rate.png" class="glightbox" data-gallery="exp4c_tables_s3x_success-exp-4c-s3-express-success-rates-heatmaps-for-fa-100-fa-90-fa-and-vo-and-fa-50-fa-and-vo-across-table-counts-and-inter-arrival-times" data-description="Exp 4c: S3 Express FA=50% FastAppend success rate. Nearly all cells are 100%. Only degradation at 20ms: 2 tables is 80.9%, 50 tables is 97.0%. At 50ms+, 98.4%+ everywhere." style="display:none">
    </a>


    <a href="/images/2026/03/providercatalog/exp4c_tables_providers/s3x_fa50/heatmap_vo_success_rate.png" class="glightbox" data-gallery="exp4c_tables_s3x_success-exp-4c-s3-express-success-rates-heatmaps-for-fa-100-fa-90-fa-and-vo-and-fa-50-fa-and-vo-across-table-counts-and-inter-arrival-times" data-description="Exp 4c: S3 Express FA=50% VO success rate. Best VO heatmap across all providers. 2 tables at 20ms is 70.0%, 50 tables is 96.5%. At 50ms, all rows reach 95.6%+. VO nearly matches FA success across the board." style="display:none">
    </a>


    <figcaption>Exp 4c: S3 Express success rates. Heatmaps for FA=100%, FA=90% (FA and VO), and FA=50% (FA and VO) across table counts and inter-arrival times.
</figcaption>
  
</figure>

  <figure class="half ">


    <a href="/images/2026/03/providercatalog/exp4c_tables_providers/s3x_fa90/xheatmap_fa_mean_latency.png" class="glightbox" data-gallery="exp4c_tables_s3x_latency-exp-4c-s3-express-commit-latency-fa-vo-mean-latency-heatmaps-for-fa-90-and-fa-50-mixes-hatched-cells-indicate-low-success-rates" data-description="Exp 4c: S3 Express FA=90% FastAppend mean latency. Very low: 1 table at 20ms is ~1487ms, 50 tables is ~227ms. At 5000ms, baseline is 79-104ms. Only 1-2 tables at 20ms show hatching.">
      <img src="/images/2026/03/providercatalog/exp4c_tables_providers/s3x_fa90/xheatmap_fa_mean_latency.png" alt="Exp 4c: S3 Express FA=90% FastAppend mean latency. Very low: 1 table at 20ms is ~1487ms, 50 tables is ~227ms. At 5000ms, baseline is 79-104ms. Only 1-2 tables at 20ms show hatching." />
    </a>


    <a href="/images/2026/03/providercatalog/exp4c_tables_providers/s3x_fa90/xheatmap_vo_mean_latency.png" class="glightbox" data-gallery="exp4c_tables_s3x_latency-exp-4c-s3-express-commit-latency-fa-vo-mean-latency-heatmaps-for-fa-90-and-fa-50-mixes-hatched-cells-indicate-low-success-rates" data-description="Exp 4c: S3 Express FA=90% ValidatedOverwrite mean latency. VO latency benefits from table partitioning: 50 tables at 20ms is ~227ms, 1 table at 20ms is ~1487ms. At 5000ms, ranges 79-104ms. Low CAS latency helps VO when combined with multiple tables.">
      <img src="/images/2026/03/providercatalog/exp4c_tables_providers/s3x_fa90/xheatmap_vo_mean_latency.png" alt="Exp 4c: S3 Express FA=90% ValidatedOverwrite mean latency. VO latency benefits from table partitioning: 50 tables at 20ms is ~227ms, 1 table at 20ms is ~1487ms. At 5000ms, ranges 79-104ms. Low CAS latency helps VO when combined with multiple tables." />
    </a>


    <a href="/images/2026/03/providercatalog/exp4c_tables_providers/s3x_fa50/xheatmap_fa_mean_latency.png" class="glightbox" data-gallery="exp4c_tables_s3x_latency-exp-4c-s3-express-commit-latency-fa-vo-mean-latency-heatmaps-for-fa-90-and-fa-50-mixes-hatched-cells-indicate-low-success-rates" data-description="Exp 4c: S3 Express FA=50% FastAppend mean latency. Very low: 50 tables at 20ms is ~478ms, converging to 80-153ms at 5000ms. Nearly identical to FA=90% FA latency. Hatched cells only at 1-2 tables at 20ms." style="display:none">
    </a>


    <a href="/images/2026/03/providercatalog/exp4c_tables_providers/s3x_fa50/xheatmap_vo_mean_latency.png" class="glightbox" data-gallery="exp4c_tables_s3x_latency-exp-4c-s3-express-commit-latency-fa-vo-mean-latency-heatmaps-for-fa-90-and-fa-50-mixes-hatched-cells-indicate-low-success-rates" data-description="Exp 4c: S3 Express FA=50% ValidatedOverwrite mean latency. VO latency benefits from table partitioning: 50 tables at 20ms is ~478ms, 1 table at 5000ms is ~153ms. At 5000ms, ranges 80-153ms. More VO operations increase latency at high load for single tables." style="display:none">
    </a>


    <figcaption>Exp 4c: S3 Express commit latency. FA/VO mean latency heatmaps for FA=90% and FA=50% mixes. Hatched cells indicate low success rates.
</figcaption>
  
</figure>

</details>

<details>
  <summary>Azure Standard</summary>

  <figure class="half ">


    <a href="/images/2026/03/providercatalog/exp4c_tables_providers/azure_fa100/heatmap_success_rate.png" class="glightbox" data-gallery="exp4c_tables_azure_success-exp-4c-azure-standard-success-rates-heatmaps-for-fa-100-fa-90-fa-and-vo-and-fa-50-fa-and-vo-across-table-counts-and-inter-arrival-times" data-description="Exp 4c: Azure FA=100% success rate by table count and inter-arrival. 1 table at 20ms is 11.1%, 50 tables at 20ms is 29.9%. Reaches 100% by 500ms for 5+ tables. Similar profile to S3 Standard.">
      <img src="/images/2026/03/providercatalog/exp4c_tables_providers/azure_fa100/heatmap_success_rate.png" alt="Exp 4c: Azure FA=100% success rate by table count and inter-arrival. 1 table at 20ms is 11.1%, 50 tables at 20ms is 29.9%. Reaches 100% by 500ms for 5+ tables. Similar profile to S3 Standard." />
    </a>


    <a href="/images/2026/03/providercatalog/exp4c_tables_providers/azure_fa90/heatmap_fa_success_rate.png" class="glightbox" data-gallery="exp4c_tables_azure_success-exp-4c-azure-standard-success-rates-heatmaps-for-fa-100-fa-90-fa-and-vo-and-fa-50-fa-and-vo-across-table-counts-and-inter-arrival-times" data-description="Exp 4c: Azure FA=90% FastAppend success rate. 1 table at 20ms is 12.0%, 50 tables is 30.0%. Very similar to FA=100%; FA success is insensitive to 10% VO in the mix.">
      <img src="/images/2026/03/providercatalog/exp4c_tables_providers/azure_fa90/heatmap_fa_success_rate.png" alt="Exp 4c: Azure FA=90% FastAppend success rate. 1 table at 20ms is 12.0%, 50 tables is 30.0%. Very similar to FA=100%; FA success is insensitive to 10% VO in the mix." />
    </a>


    <a href="/images/2026/03/providercatalog/exp4c_tables_providers/azure_fa90/heatmap_vo_success_rate.png" class="glightbox" data-gallery="exp4c_tables_azure_success-exp-4c-azure-standard-success-rates-heatmaps-for-fa-100-fa-90-fa-and-vo-and-fa-50-fa-and-vo-across-table-counts-and-inter-arrival-times" data-description="Exp 4c: Azure FA=90% ValidatedOverwrite success rate. VO benefits from table partitioning: 1 table at 100ms is 16.8%, 50 tables at 100ms is 86.5%. At 200ms, 50 tables reach 99.1%. 1 table at 200ms is 48.2%." style="display:none">
    </a>


    <a href="/images/2026/03/providercatalog/exp4c_tables_providers/azure_fa50/heatmap_fa_success_rate.png" class="glightbox" data-gallery="exp4c_tables_azure_success-exp-4c-azure-standard-success-rates-heatmaps-for-fa-100-fa-90-fa-and-vo-and-fa-50-fa-and-vo-across-table-counts-and-inter-arrival-times" data-description="Exp 4c: Azure FA=50% FastAppend success rate. 1 table at 20ms is 18.3%, 50 tables is 30.3%. At 100ms, 50 tables reach 86.9%. Reaches 100% by 500ms for 2+ tables." style="display:none">
    </a>


    <a href="/images/2026/03/providercatalog/exp4c_tables_providers/azure_fa50/heatmap_vo_success_rate.png" class="glightbox" data-gallery="exp4c_tables_azure_success-exp-4c-azure-standard-success-rates-heatmaps-for-fa-100-fa-90-fa-and-vo-and-fa-50-fa-and-vo-across-table-counts-and-inter-arrival-times" data-description="Exp 4c: Azure FA=50% ValidatedOverwrite success rate. 1 table at 100ms is 24.8%, 50 tables at 100ms is 86.5%. 1 table at 20ms is 2.4%. FA and VO success rates converge at high table counts." style="display:none">
    </a>


    <figcaption>Exp 4c: Azure Standard success rates. Heatmaps for FA=100%, FA=90% (FA and VO), and FA=50% (FA and VO) across table counts and inter-arrival times.
</figcaption>
  
</figure>

  <figure class="half ">


    <a href="/images/2026/03/providercatalog/exp4c_tables_providers/azure_fa90/xheatmap_fa_mean_latency.png" class="glightbox" data-gallery="exp4c_tables_azure_latency-exp-4c-azure-standard-commit-latency-fa-vo-mean-latency-heatmaps-for-fa-90-and-fa-50-mixes-hatched-cells-indicate-low-success-rates" data-description="Exp 4c: Azure FA=90% FastAppend mean latency. 1 table at 5000ms is ~1037ms, 50 tables at 5000ms is ~670ms. At 20ms, FA latency for 1-50 tables ranges ~2106-2961ms. Hatched cells cover the left half.">
      <img src="/images/2026/03/providercatalog/exp4c_tables_providers/azure_fa90/xheatmap_fa_mean_latency.png" alt="Exp 4c: Azure FA=90% FastAppend mean latency. 1 table at 5000ms is ~1037ms, 50 tables at 5000ms is ~670ms. At 20ms, FA latency for 1-50 tables ranges ~2106-2961ms. Hatched cells cover the left half." />
    </a>


    <a href="/images/2026/03/providercatalog/exp4c_tables_providers/azure_fa90/xheatmap_vo_mean_latency.png" class="glightbox" data-gallery="exp4c_tables_azure_latency-exp-4c-azure-standard-commit-latency-fa-vo-mean-latency-heatmaps-for-fa-90-and-fa-50-mixes-hatched-cells-indicate-low-success-rates" data-description="Exp 4c: Azure FA=90% ValidatedOverwrite mean latency. VO latency higher than FA: at 5000ms, ranges from ~1037ms (1 table) down with more tables. At high load, 1 table latency reaches tens of seconds. Hatched cells cover the left region.">
      <img src="/images/2026/03/providercatalog/exp4c_tables_providers/azure_fa90/xheatmap_vo_mean_latency.png" alt="Exp 4c: Azure FA=90% ValidatedOverwrite mean latency. VO latency higher than FA: at 5000ms, ranges from ~1037ms (1 table) down with more tables. At high load, 1 table latency reaches tens of seconds. Hatched cells cover the left region." />
    </a>


    <a href="/images/2026/03/providercatalog/exp4c_tables_providers/azure_fa50/xheatmap_fa_mean_latency.png" class="glightbox" data-gallery="exp4c_tables_azure_latency-exp-4c-azure-standard-commit-latency-fa-vo-mean-latency-heatmaps-for-fa-90-and-fa-50-mixes-hatched-cells-indicate-low-success-rates" data-description="Exp 4c: Azure FA=50% FastAppend mean latency. Similar profile to FA=90% FA latency. 1 table at 5000ms is ~1923ms, 50 tables at 5000ms is ~682ms. Hatched cells dominate the left half." style="display:none">
    </a>


    <a href="/images/2026/03/providercatalog/exp4c_tables_providers/azure_fa50/xheatmap_vo_mean_latency.png" class="glightbox" data-gallery="exp4c_tables_azure_latency-exp-4c-azure-standard-commit-latency-fa-vo-mean-latency-heatmaps-for-fa-90-and-fa-50-mixes-hatched-cells-indicate-low-success-rates" data-description="Exp 4c: Azure FA=50% ValidatedOverwrite mean latency. VO latency higher than FA: at 5000ms, ranges from ~1923ms (1 table) down to ~682ms (50 tables). At high load, single-table latency reaches tens of seconds. Hatched cells cover the left portion." style="display:none">
    </a>


    <figcaption>Exp 4c: Azure Standard commit latency. FA/VO mean latency heatmaps for FA=90% and FA=50% mixes. Hatched cells indicate low success rates.
</figcaption>
  
</figure>

</details>

<details>
  <summary>Azure Premium</summary>

  <figure class="half ">


    <a href="/images/2026/03/providercatalog/exp4c_tables_providers/azurex_fa100/heatmap_success_rate.png" class="glightbox" data-gallery="exp4c_tables_azurex_success-exp-4c-azure-premium-success-rates-heatmaps-for-fa-100-fa-90-fa-and-vo-and-fa-50-fa-and-vo-across-table-counts-and-inter-arrival-times" data-description="Exp 4c: Azure Premium FA=100% success rate. Better than standard Azure: 1 table at 20ms is 11.2%, 50 tables is 31.6%. Reaches 100% by 500ms for 2+ tables. 1 table at 100ms is 49.0% vs Azure's 44.1%.">
      <img src="/images/2026/03/providercatalog/exp4c_tables_providers/azurex_fa100/heatmap_success_rate.png" alt="Exp 4c: Azure Premium FA=100% success rate. Better than standard Azure: 1 table at 20ms is 11.2%, 50 tables is 31.6%. Reaches 100% by 500ms for 2+ tables. 1 table at 100ms is 49.0% vs Azure's 44.1%." />
    </a>


    <a href="/images/2026/03/providercatalog/exp4c_tables_providers/azurex_fa90/heatmap_fa_success_rate.png" class="glightbox" data-gallery="exp4c_tables_azurex_success-exp-4c-azure-premium-success-rates-heatmaps-for-fa-100-fa-90-fa-and-vo-and-fa-50-fa-and-vo-across-table-counts-and-inter-arrival-times" data-description="Exp 4c: Azure Premium FA=90% FastAppend success rate. 1 table at 20ms is 12.4%, 50 tables is 31.7%. At 100ms, 50 tables is 93.7%. Noticeably better than standard Azure FA=90% at high table counts.">
      <img src="/images/2026/03/providercatalog/exp4c_tables_providers/azurex_fa90/heatmap_fa_success_rate.png" alt="Exp 4c: Azure Premium FA=90% FastAppend success rate. 1 table at 20ms is 12.4%, 50 tables is 31.7%. At 100ms, 50 tables is 93.7%. Noticeably better than standard Azure FA=90% at high table counts." />
    </a>


    <a href="/images/2026/03/providercatalog/exp4c_tables_providers/azurex_fa90/heatmap_vo_success_rate.png" class="glightbox" data-gallery="exp4c_tables_azurex_success-exp-4c-azure-premium-success-rates-heatmaps-for-fa-100-fa-90-fa-and-vo-and-fa-50-fa-and-vo-across-table-counts-and-inter-arrival-times" data-description="Exp 4c: Azure Premium FA=90% VO success rate. 50 tables at 100ms is 93.3%, 10 tables at 100ms is 89.3%. 1 table at 100ms is 18.4%. VO benefits strongly from table partitioning with Premium CAS latency." style="display:none">
    </a>


    <a href="/images/2026/03/providercatalog/exp4c_tables_providers/azurex_fa50/heatmap_fa_success_rate.png" class="glightbox" data-gallery="exp4c_tables_azurex_success-exp-4c-azure-premium-success-rates-heatmaps-for-fa-100-fa-90-fa-and-vo-and-fa-50-fa-and-vo-across-table-counts-and-inter-arrival-times" data-description="Exp 4c: Azure Premium FA=50% FastAppend success rate. Best Azure heatmap: 1 table at 20ms is 21.3%, 50 tables is 32.2%. At 100ms, 50 tables is 93.7%. FA and VO converge at high table counts." style="display:none">
    </a>


    <a href="/images/2026/03/providercatalog/exp4c_tables_providers/azurex_fa50/heatmap_vo_success_rate.png" class="glightbox" data-gallery="exp4c_tables_azurex_success-exp-4c-azure-premium-success-rates-heatmaps-for-fa-100-fa-90-fa-and-vo-and-fa-50-fa-and-vo-across-table-counts-and-inter-arrival-times" data-description="Exp 4c: Azure Premium FA=50% VO success rate. 1 table at 100ms is 30.1%, 50 tables at 100ms is 93.3%. At 200ms, 1 table reaches 70.6%. VO converges to FA success rates at high table counts." style="display:none">
    </a>


    <figcaption>Exp 4c: Azure Premium success rates. Heatmaps for FA=100%, FA=90% (FA and VO), and FA=50% (FA and VO) across table counts and inter-arrival times.
</figcaption>
  
</figure>

  <figure class="half ">


    <a href="/images/2026/03/providercatalog/exp4c_tables_providers/azurex_fa90/xheatmap_fa_mean_latency.png" class="glightbox" data-gallery="exp4c_tables_azurex_latency-exp-4c-azure-premium-commit-latency-fa-vo-mean-latency-heatmaps-for-fa-90-and-fa-50-mixes-hatched-cells-indicate-low-success-rates" data-description="Exp 4c: Azure Premium FA=90% FastAppend mean latency. 1 table at 5000ms is ~728ms, 50 tables at 5000ms is ~471ms. At 20ms, 50 tables is ~1515ms. Hatched cells cover the left portion.">
      <img src="/images/2026/03/providercatalog/exp4c_tables_providers/azurex_fa90/xheatmap_fa_mean_latency.png" alt="Exp 4c: Azure Premium FA=90% FastAppend mean latency. 1 table at 5000ms is ~728ms, 50 tables at 5000ms is ~471ms. At 20ms, 50 tables is ~1515ms. Hatched cells cover the left portion." />
    </a>


    <a href="/images/2026/03/providercatalog/exp4c_tables_providers/azurex_fa90/xheatmap_vo_mean_latency.png" class="glightbox" data-gallery="exp4c_tables_azurex_latency-exp-4c-azure-premium-commit-latency-fa-vo-mean-latency-heatmaps-for-fa-90-and-fa-50-mixes-hatched-cells-indicate-low-success-rates" data-description="Exp 4c: Azure Premium FA=90% ValidatedOverwrite mean latency. VO latency higher than FA but benefits from table partitioning: at 5000ms, ranges from ~728ms (1 table) down to ~471ms (50 tables). Hatched cells cover the left region.">
      <img src="/images/2026/03/providercatalog/exp4c_tables_providers/azurex_fa90/xheatmap_vo_mean_latency.png" alt="Exp 4c: Azure Premium FA=90% ValidatedOverwrite mean latency. VO latency higher than FA but benefits from table partitioning: at 5000ms, ranges from ~728ms (1 table) down to ~471ms (50 tables). Hatched cells cover the left region." />
    </a>


    <a href="/images/2026/03/providercatalog/exp4c_tables_providers/azurex_fa50/xheatmap_fa_mean_latency.png" class="glightbox" data-gallery="exp4c_tables_azurex_latency-exp-4c-azure-premium-commit-latency-fa-vo-mean-latency-heatmaps-for-fa-90-and-fa-50-mixes-hatched-cells-indicate-low-success-rates" data-description="Exp 4c: Azure Premium FA=50% FastAppend mean latency. 1 table at 5000ms is ~1270ms, 50 tables at 5000ms is ~474ms. Hatched region covers the left half." style="display:none">
    </a>


    <a href="/images/2026/03/providercatalog/exp4c_tables_providers/azurex_fa50/xheatmap_vo_mean_latency.png" class="glightbox" data-gallery="exp4c_tables_azurex_latency-exp-4c-azure-premium-commit-latency-fa-vo-mean-latency-heatmaps-for-fa-90-and-fa-50-mixes-hatched-cells-indicate-low-success-rates" data-description="Exp 4c: Azure Premium FA=50% ValidatedOverwrite mean latency. VO latency higher than FA: at 5000ms, ranges from ~1270ms (1 table) to ~474ms (50 tables). Lower than standard Azure. Hatched cells cover the left portion." style="display:none">
    </a>


    <figcaption>Exp 4c: Azure Premium commit latency. FA/VO mean latency heatmaps for FA=90% and FA=50% mixes. Hatched cells indicate low success rates.
</figcaption>
  
</figure>

</details>

<details>
  <summary>Google Cloud Storage (GCS)</summary>

  <figure class="half ">


    <a href="/images/2026/03/providercatalog/exp4c_tables_providers/gcp_fa100/heatmap_success_rate.png" class="glightbox" data-gallery="exp4c_tables_gcp_success-exp-4c-gcs-success-rates-heatmaps-for-fa-100-fa-90-fa-and-vo-and-fa-50-fa-and-vo-across-table-counts-and-inter-arrival-times" data-description="Exp 4c: GCS FA=100% success rate. Worst-performing provider. 1 table at 20ms is 2.5%, 50 tables is 7.7%. Does not reach 100% until inter-arrival 2000 for 1-2 tables. Degradation extends much further right than other providers.">
      <img src="/images/2026/03/providercatalog/exp4c_tables_providers/gcp_fa100/heatmap_success_rate.png" alt="Exp 4c: GCS FA=100% success rate. Worst-performing provider. 1 table at 20ms is 2.5%, 50 tables is 7.7%. Does not reach 100% until inter-arrival 2000 for 1-2 tables. Degradation extends much further right than other providers." />
    </a>


    <a href="/images/2026/03/providercatalog/exp4c_tables_providers/gcp_fa90/heatmap_fa_success_rate.png" class="glightbox" data-gallery="exp4c_tables_gcp_success-exp-4c-gcs-success-rates-heatmaps-for-fa-100-fa-90-fa-and-vo-and-fa-50-fa-and-vo-across-table-counts-and-inter-arrival-times" data-description="Exp 4c: GCS FA=90% FastAppend success rate. Much worse than all other providers. 1 table at 20ms is 2.8%, 200ms is 23.6%, 500ms is 50.7%. 50 tables at 20ms is 7.7%.">
      <img src="/images/2026/03/providercatalog/exp4c_tables_providers/gcp_fa90/heatmap_fa_success_rate.png" alt="Exp 4c: GCS FA=90% FastAppend success rate. Much worse than all other providers. 1 table at 20ms is 2.8%, 200ms is 23.6%, 500ms is 50.7%. 50 tables at 20ms is 7.7%." />
    </a>


    <a href="/images/2026/03/providercatalog/exp4c_tables_providers/gcp_fa90/heatmap_vo_success_rate.png" class="glightbox" data-gallery="exp4c_tables_gcp_success-exp-4c-gcs-success-rates-heatmaps-for-fa-100-fa-90-fa-and-vo-and-fa-50-fa-and-vo-across-table-counts-and-inter-arrival-times" data-description="Exp 4c: GCS FA=90% VO success rate. Worst VO heatmap across providers. 1 table at 500ms is 19.0%, 50 tables at 100ms is 32.0%. Deep-red zone covers the left portion for 1-2 tables." style="display:none">
    </a>


    <a href="/images/2026/03/providercatalog/exp4c_tables_providers/gcp_fa50/heatmap_fa_success_rate.png" class="glightbox" data-gallery="exp4c_tables_gcp_success-exp-4c-gcs-success-rates-heatmaps-for-fa-100-fa-90-fa-and-vo-and-fa-50-fa-and-vo-across-table-counts-and-inter-arrival-times" data-description="Exp 4c: GCS FA=50% FastAppend success rate. 1 table at 20ms is 4.8%, 100ms is 20.3%. 50 tables at 20ms is 7.8%. Still the worst provider." style="display:none">
    </a>


    <a href="/images/2026/03/providercatalog/exp4c_tables_providers/gcp_fa50/heatmap_vo_success_rate.png" class="glightbox" data-gallery="exp4c_tables_gcp_success-exp-4c-gcs-success-rates-heatmaps-for-fa-100-fa-90-fa-and-vo-and-fa-50-fa-and-vo-across-table-counts-and-inter-arrival-times" data-description="Exp 4c: GCS FA=50% VO success rate. Most degraded heatmap of all. 1 table at 500ms is 30.8%, 50 tables at 100ms is 32.2%. GCS's high CAS latency limits both FA and VO at moderate arrival rates." style="display:none">
    </a>


    <figcaption>Exp 4c: GCS success rates. Heatmaps for FA=100%, FA=90% (FA and VO), and FA=50% (FA and VO) across table counts and inter-arrival times.
</figcaption>
  
</figure>

  <figure class="half ">


    <a href="/images/2026/03/providercatalog/exp4c_tables_providers/gcp_fa90/xheatmap_fa_mean_latency.png" class="glightbox" data-gallery="exp4c_tables_gcp_latency-exp-4c-gcs-commit-latency-fa-vo-mean-latency-heatmaps-for-fa-90-and-fa-50-mixes-hatched-cells-indicate-low-success-rates" data-description="Exp 4c: GCS FA=90% FastAppend mean latency. Very high: 1 table at 5000ms is ~4141ms, 50 tables at 5000ms is ~2352ms. GCS's high base CAS latency inflates all commit latencies. Hatched cells cover most of the left region.">
      <img src="/images/2026/03/providercatalog/exp4c_tables_providers/gcp_fa90/xheatmap_fa_mean_latency.png" alt="Exp 4c: GCS FA=90% FastAppend mean latency. Very high: 1 table at 5000ms is ~4141ms, 50 tables at 5000ms is ~2352ms. GCS's high base CAS latency inflates all commit latencies. Hatched cells cover most of the left region." />
    </a>


    <a href="/images/2026/03/providercatalog/exp4c_tables_providers/gcp_fa90/xheatmap_vo_mean_latency.png" class="glightbox" data-gallery="exp4c_tables_gcp_latency-exp-4c-gcs-commit-latency-fa-vo-mean-latency-heatmaps-for-fa-90-and-fa-50-mixes-hatched-cells-indicate-low-success-rates" data-description="Exp 4c: GCS FA=90% ValidatedOverwrite mean latency. Very high due to GCS's high base CAS latency. At 5000ms, ranges ~2352-4141ms across table counts. At high load, 50 tables at 20ms reaches ~6632ms. Most cells are hatched.">
      <img src="/images/2026/03/providercatalog/exp4c_tables_providers/gcp_fa90/xheatmap_vo_mean_latency.png" alt="Exp 4c: GCS FA=90% ValidatedOverwrite mean latency. Very high due to GCS's high base CAS latency. At 5000ms, ranges ~2352-4141ms across table counts. At high load, 50 tables at 20ms reaches ~6632ms. Most cells are hatched." />
    </a>


    <a href="/images/2026/03/providercatalog/exp4c_tables_providers/gcp_fa50/xheatmap_fa_mean_latency.png" class="glightbox" data-gallery="exp4c_tables_gcp_latency-exp-4c-gcs-commit-latency-fa-vo-mean-latency-heatmaps-for-fa-90-and-fa-50-mixes-hatched-cells-indicate-low-success-rates" data-description="Exp 4c: GCS FA=50% FastAppend mean latency. Very high: 1 table at 5000ms is ~7974ms, 50 tables at 5000ms is ~2394ms. GCS's high CAS baseline inflates all latencies. Most cells are hatched." style="display:none">
    </a>


    <a href="/images/2026/03/providercatalog/exp4c_tables_providers/gcp_fa50/xheatmap_vo_mean_latency.png" class="glightbox" data-gallery="exp4c_tables_gcp_latency-exp-4c-gcs-commit-latency-fa-vo-mean-latency-heatmaps-for-fa-90-and-fa-50-mixes-hatched-cells-indicate-low-success-rates" data-description="Exp 4c: GCS FA=50% ValidatedOverwrite mean latency. Worst case across all providers and mixes. At 5000ms, ranges from ~7974ms (1 table) to ~2394ms (50 tables). At high load, reaches 20000+ ms. Most cells are hatched." style="display:none">
    </a>


    <figcaption>Exp 4c: GCS commit latency. FA/VO mean latency heatmaps for FA=90% and FA=50% mixes. Hatched cells indicate low success rates.
</figcaption>
  
</figure>

</details>

<div class="footnotes" role="doc-endnotes">
  <ol>
    <li id="fn:moreplots" role="doc-endnote">
      <p>The full set of plots for these simulations are <a href="/files/2026-providercatalog-plots.zip">here</a>. <a href="#fnref:moreplots" class="reversefootnote" role="doc-backlink">&#8617;</a></p>
    </li>
  </ol>
</div>]]></content><author><name>Chris Douglas</name><email>chris_douglas@berkeley.edu</email><uri>https://cdouglas.github.io</uri></author><category term="lst" /><category term="iceberg" /><summary type="html"><![CDATA[Simulating multi-table commit rates across S3, Azure, and GCS for Apache Iceberg catalog-as-file commits.]]></summary><media:thumbnail xmlns:media="http://search.yahoo.com/mrss/" url="/2026/03/providercatalog/exp4c_tables_providers/workload_knee/workload_knee_vs_tables.png" /><media:content medium="image" url="/2026/03/providercatalog/exp4c_tables_providers/workload_knee/workload_knee_vs_tables.png" xmlns:media="http://search.yahoo.com/mrss/" /></entry><entry><title type="html">Simulating Catalog and Table Conflicts</title><link href="/posts/2026/03/catalog" rel="alternate" type="text/html" title="Simulating Catalog and Table Conflicts" /><published>2026-03-09T15:00:00+00:00</published><updated>2026-03-09T15:00:00+00:00</updated><id>/posts/2026/03/catalog</id><content type="html" xml:base="/posts/2026/03/catalog"><![CDATA[<h1 id="tldr">tl;dr</h1>

<p><a href="#correction-2026-06-09">Update: Corrected simulations 2026-06-09</a></p>

<p>The root and leaves of table formats- catalog services and replacements for
Parquet files- are getting a lot of attention in industry and academia. However,
the inner nodes of table formats like Apache Iceberg limit write throughput to
<strong>1-2 commits</strong> per second, even running well-behaved workloads in optimistic
conditions.</p>

<ol>
  <li>
    <p><strong>Sustained commit rates above 1-2 commits/sec are unattainable</strong> without making some transactions uncommittable.</p>
  </li>
  <li>
    <p><strong>Storage I/O is the primary bottleneck</strong> for single-table workloads, even with an unrealistically fast catalog. Catalog compare-and-set (CAS) latency up to 120ms adds only modest overhead for single-table workloads.</p>
  </li>
  <li>
    <p><strong>IO cascades extend tail latency</strong>. Conflicts requiring work proportional to the number of snapshots committed not only increase tail latency, they also create IO convoys that space out commit attempts.</p>
  </li>
</ol>

<h1 id="why-bother">Why bother?</h1>

<p>Table formats are designed for read-dominant workloads with low update rates:
non-blocking reads, atomic updates, and cheap, scalable metadata at rest.
Conflict is rare by construction. If table update rates are steady, it’s usually
an ingest workload with a dedicated writer and occasional conflicts caused by
maintenance transactions. In multi-writer workloads, write rates are expected to
be low, and an exponential backoff will probe around spikes in load.</p>

<p>Table format commit protocols are like an airport without a control tower.
Absent coordination, either aircraft land infrequently (read-dominant workload)
or each aircraft takes off knowing when it’s supposed to land (dedicated or
externally coordinated writers). The table format community seems to have
reached a consensus that airports must have control towers (i.e., catalog
services) to sustain higher throughput. So: <em>when</em> do we need a control tower?</p>

<p>Given what we <a href="/posts/2026/01/conditional">learned</a> about the latency of
conditional operations in object stores, when does the cost of resolving
conflicts limit throughput for a file-based catalog? This post will focus on
single-table workloads. We’ll explore multi-table catalogs and architectural
alternatives in future posts.</p>

<h1 id="background-table-formats-and-the-catalog">Background: Table Formats and the Catalog</h1>

<p>Table formats like <a href="https://iceberg.apache.org">Apache Iceberg</a>, <a href="https://hudi.apache.org">Apache
Hudi</a>, <a href="https://delta.io">Delta Lake</a>, and
<a href="https://lance.org/">Lance</a> specify conventions used by participants to ensure
both that readers access consistent snapshots, and that updates to table data
are ordered. Unlike traditional database systems, writers <em>autonomously
self-certify</em> the consistency of their transaction against the current state of
the table before atomically installing a new snapshot. There is no coordination
across transactions outside of storage; in many settings, the set of running
transactions is neither recorded nor discoverable.</p>

<p>Write transactions follow a coarse-grained, optimistic 3-phase lifecycle:
versioned action, validation, and commit. Versioned actions track the snapshot
version for reads and sequester writes outside the tree of objects reachable
from the visible table. Commit is a race: transactions attempt to atomically
change the current version to reflect their updates. Successful commits update
the shared/visible table state; failed commits must retry after repairing their
prepared transaction.</p>

<figure class="center ">


    <a href="/images/2026/03/catalog/commit-path.png" class="glightbox" data-gallery="iceberg_arch-read-path-and-write-path-not-illustrated-in-apache-iceberg" data-description="Iceberg read and write paths. Reads: (1) get table root from catalog, (2) read root object, (3) follow snapshot pointers, (4) read data files. Writes: (1) record read snapshot, (2) write new data and metadata, (3) create new root, (4) CAS at catalog; on failure, (5) validate intervening commits, (6) write merged metadata, (7) retry CAS.">
      <img src="/images/2026/03/catalog/commit-path.png" alt="Iceberg read and write paths. Reads: (1) get table root from catalog, (2) read root object, (3) follow snapshot pointers, (4) read data files. Writes: (1) record read snapshot, (2) write new data and metadata, (3) create new root, (4) CAS at catalog; on failure, (5) validate intervening commits, (6) write merged metadata, (7) retry CAS." />
    </a>


    <figcaption>Read path and write path (not illustrated) in Apache Iceberg
</figcaption>
  
</figure>

<p>Also unlike traditional database pages, data referenced in a snapshot contains
only committed data. Readers may filter tombstoned data, but a snapshot never
references uncommitted data written by an active transaction.</p>

<h2 id="catalog">Catalog</h2>

<p>The Iceberg Catalog- the <a href="https://ducklake.select/2025/05/27/ducklake-01/">saddest table of all
time</a>- manages a tiny amount of
state i.e., the locations of the root object for every table<sup id="fnref:tinydata" role="doc-noteref"><a href="#fn:tinydata" class="footnote" rel="footnote">1</a></sup>. Like
the root of a <a href="https://dl.acm.org/doi/abs/10.1145/1326542.1326544">CoW B-tree</a>,
an update to a table shadows all affected nodes including the root.</p>

<p>The catalog is a natural bottleneck for concurrent transactions… right?</p>

<p>Yes and no. Conflicts on this pointer will cause losing transactions to verify
and repair table data committed since their read snapshot. If the data files and
manifest files remain valid as-written, then the transaction only needs to merge
metadata references. Concretely, it must read the current table metadata (JSON
blob at the root of the table;
<strong>~1MiB</strong> but potentially
<a href="https://github.com/apache/iceberg/issues/5219">larger</a>) and a subset of the
manifest list(s) committed since the read snapshot (tens, multiples of
<strong>~100KiB</strong> each). The transaction merges and writes a new manifest list and
table metadata, and retries the commit at the catalog.</p>

<p>Conflicts <em>detected</em> at the catalog limit throughput, but the latency of the
root is not necessarily the bottleneck.</p>

<h2 id="workload-mix-fastappend-fa-and-validatedoverwrite-vo-transactions">Workload Mix: FastAppend (FA) and ValidatedOverwrite (VO) Transactions</h2>
<p><a id="workload-mix"></a></p>

<p>Our workload will mix “light” and “heavy” transactions from Iceberg.</p>

<p>A
<a href="https://github.com/apache/iceberg/blob/apache-iceberg-1.10.1/core/src/main/java/org/apache/iceberg/FastAppend.java">FastAppend</a>
transaction is our <em>“light”</em> transaction type that appends new data files and
metadata (blind writes). Conflicts with other transactions are resolved by
reading the table manifest and the <em>latest</em> manifest list, merging and writing
both to create a new snapshot, then retrying the commit at the catalog.</p>

<p>A
<a href="https://github.com/apache/iceberg/blob/apache-iceberg-1.10.1/api/src/main/java/org/apache/iceberg/OverwriteFiles.java">ValidatedOverwrite</a>
transaction is our <em>“heavy”</em> transaction type: an overwrite with validation
enabled. It rewrites and replaces data files and metadata, so it needs to
examine 
<a href="https://github.com/apache/iceberg/blob/apache-iceberg-1.10.1/core/src/main/java/org/apache/iceberg/MergingSnapshotProducer.java#L878">all</a>
the manifest lists committed between its read snapshot and the current snapshot
to check for conflicts. It can then write the merged manifest list and table
metadata and retry the commit at the catalog.</p>

<p>In what follows, we assume that <strong>all</strong> conflicts are spurious, require no reads
beyond the manifest list, and failures are caused only by exhausting the retry
budget at the catalog.</p>

<h1 id="simulating-commit-throughput">Simulating Commit Throughput</h1>

<p>Using a discrete event simulator
(<a href="https://github.com/cdouglas/endive">Endive</a><sup id="fnref:vibesimulator" role="doc-noteref"><a href="#fn:vibesimulator" class="footnote" rel="footnote">2</a></sup>), we can submit a
transaction workload against a virtual catalog and object store. The simulator
models the transaction lifecycle, including the cost of preparing retries after
conflicts, and the latency of storage operations.</p>

<p><strong>1a</strong> We start with an optimistic baseline: what happens to transaction
throughput/latency if we use an implausibly fast catalog (1ms) and <em>only</em>
FastAppend (light) transactions in a single table. We sweep arrival rates from
20ms (50 commits/sec) up to 5000ms (0.2 commits/sec).</p>

<p><strong>1b</strong> Then we add ValidatedOverwrite (heavy) transactions into the mix. The rate a
single table can sustain is lower than whatever commit rate causes these
transactions to fail. By analogy, the rate at which small planes land safely is
irrelevant if your airport is ringed by wrecked cargo planes that circled
until they ran out of fuel. Using the same 1ms catalog, we sweep the ratio of FA
(light) and VO (heavy) transactions to see how the workload mix affects success
rates and latency.</p>

<p><strong>2a,2b</strong> With this baseline for a single table and an instant catalog, we add
another dimension: catalog latency. We sweep the compare-and-set (CAS) latency
from 1ms up to 120ms. We run this sweep for both FA-only and 90/10 FA/VO
workloads to measure success rate and commit latency sensitivity to catalog
latency, still for a single table.</p>

<h2 id="experiment-summary">Experiment Summary</h2>

<table>
  <thead>
    <tr>
      <th>Exp</th>
      <th>Description</th>
      <th>Fixed</th>
      <th>Swept</th>
      <th>Configs</th>
    </tr>
  </thead>
  <tbody>
    <tr>
      <td><strong>1a</strong></td>
      <td><a href="#exp1">FA baseline, instant catalog</a></td>
      <td>1 table, 1 group, FA=100%, instant catalog (1ms), S3, conflicts=0%</td>
      <td><code class="language-plaintext highlighter-rouge">inter_arrival_scale</code></td>
      <td>10</td>
    </tr>
    <tr>
      <td><strong>1b</strong></td>
      <td><a href="#exp2">FA/VO operation mix</a></td>
      <td>1 table, 1 group, instant catalog (1ms), S3, conflicts=0%</td>
      <td><code class="language-plaintext highlighter-rouge">fast_append_ratio</code><br /><code class="language-plaintext highlighter-rouge">inter_arrival_scale</code></td>
      <td>80</td>
    </tr>
    <tr>
      <td><strong>2a</strong></td>
      <td><a href="#exp3a">Catalog CAS latency (FA)</a></td>
      <td>1 table, 1 group, FA=100%, S3, conflicts=0%</td>
      <td><code class="language-plaintext highlighter-rouge">catalog_latency_ms</code><br /><code class="language-plaintext highlighter-rouge">inter_arrival_scale</code></td>
      <td>70</td>
    </tr>
    <tr>
      <td><strong>2b</strong></td>
      <td><a href="#exp3b">Catalog CAS latency (mix)</a></td>
      <td>1 table, 1 group, FA=90%/VO=10%, S3, conflicts=0%</td>
      <td><code class="language-plaintext highlighter-rouge">catalog_latency_ms</code><br /><code class="language-plaintext highlighter-rouge">inter_arrival_scale</code></td>
      <td>70</td>
    </tr>
  </tbody>
</table>

<table>
  <thead>
    <tr>
      <th>Parameter</th>
      <th>Values</th>
      <th>Description</th>
    </tr>
  </thead>
  <tbody>
    <tr>
      <td><code class="language-plaintext highlighter-rouge">inter_arrival_scale</code></td>
      <td>[20, 50, 100, 200, 300, 400, 500, 1000, 2000, 5000] ms</td>
      <td>Scale parameter for the exponential distribution of transaction inter-arrival times. Lower values correspond to higher transaction rates.</td>
    </tr>
    <tr>
      <td><code class="language-plaintext highlighter-rouge">fast_append_ratio</code></td>
      <td>[1.0, 0.9, 0.8, 0.7, 0.5, 0.3, 0.1, 0.0]</td>
      <td>Ratio of FastAppend (light) transactions to ValidatedOverwrite (heavy) transactions in the workload mix. 1.0 means all transactions are FastAppend, while 0.0 means all transactions are ValidatedOverwrite.</td>
    </tr>
    <tr>
      <td><code class="language-plaintext highlighter-rouge">catalog_latency_ms</code></td>
      <td>[1, 5, 10, 20, 50, 80, 120] ms</td>
      <td>Latency of the catalog’s compare-and-set (CAS) operation in milliseconds. This models the time it takes for a transaction to attempt a commit and receive a response from the catalog.</td>
    </tr>
  </tbody>
</table>

<p>In all experiments, the manifest list and table metadata sizes are fixed (10KiB
and 100KiB, respectively). These do <em>not</em> use the conditional operations
measured earlier, but unconditional <code class="language-plaintext highlighter-rouge">GET</code> and <code class="language-plaintext highlighter-rouge">PUT</code> operations for S3:</p>

<details>
  <summary>Latency distributions for S3 Standard (click to expand)</summary>

  <h2 id="distribution-parameters">Distribution Parameters</h2>

  <h3 id="get-unconditional-read">GET (unconditional read)</h3>

  <p>Modeled as <code class="language-plaintext highlighter-rouge">Lognormal(mu=ln(median), sigma)</code>, floored at <code class="language-plaintext highlighter-rouge">min_latency_ms</code>.</p>

  <table>
    <thead>
      <tr>
        <th>Operation</th>
        <th style="text-align: right">median (ms)</th>
        <th style="text-align: right">sigma</th>
        <th style="text-align: right">min_latency (ms)</th>
      </tr>
    </thead>
    <tbody>
      <tr>
        <td>GET</td>
        <td style="text-align: right">27</td>
        <td style="text-align: right">0.62</td>
        <td style="text-align: right">10</td>
      </tr>
    </tbody>
  </table>

  <p><code class="language-plaintext highlighter-rouge">GET</code> operations don’t include sizes because latency is dominated by fixed
overheads at these sizes. The current simulator uses the size-based formula for
<code class="language-plaintext highlighter-rouge">PUT</code>, but in these simulations latencies are drawn from the above lognormal
distribution.</p>

  <h3 id="put-unconditional-write">PUT (unconditional write)</h3>

  <p>Modeled as <code class="language-plaintext highlighter-rouge">Lognormal(mu=ln(base + rate * size_MiB), sigma)</code>, floored at <code class="language-plaintext highlighter-rouge">min_latency_ms</code>.</p>

  <table>
    <thead>
      <tr>
        <th>Operation</th>
        <th style="text-align: right">base (ms)</th>
        <th style="text-align: right">rate (ms/MiB)</th>
        <th style="text-align: right">sigma</th>
        <th style="text-align: right">min_latency (ms)</th>
      </tr>
    </thead>
    <tbody>
      <tr>
        <td>PUT</td>
        <td style="text-align: right">60</td>
        <td style="text-align: right">20</td>
        <td style="text-align: right">0.29</td>
        <td style="text-align: right">10</td>
      </tr>
    </tbody>
  </table>

  <h2 id="percentiles">Percentiles</h2>

  <table>
    <thead>
      <tr>
        <th>Operation</th>
        <th style="text-align: right">p5</th>
        <th style="text-align: right">p10</th>
        <th style="text-align: right">p25</th>
        <th style="text-align: right">p50</th>
        <th style="text-align: right">p75</th>
        <th style="text-align: right">p90</th>
        <th style="text-align: right">p95</th>
        <th style="text-align: right">p99</th>
      </tr>
    </thead>
    <tbody>
      <tr>
        <td>GET</td>
        <td style="text-align: right">10</td>
        <td style="text-align: right">12</td>
        <td style="text-align: right">18</td>
        <td style="text-align: right">27</td>
        <td style="text-align: right">41</td>
        <td style="text-align: right">60</td>
        <td style="text-align: right">75</td>
        <td style="text-align: right">114</td>
      </tr>
      <tr>
        <td>PUT</td>
        <td style="text-align: right">37</td>
        <td style="text-align: right">42</td>
        <td style="text-align: right">50</td>
        <td style="text-align: right">60</td>
        <td style="text-align: right">73</td>
        <td style="text-align: right">87</td>
        <td style="text-align: right">97</td>
        <td style="text-align: right">118</td>
      </tr>
    </tbody>
  </table>

</details>

<p>All experiments use 5 seeds, retry=10, txn runtime mean=180s. Each run simulates
1 hour, with the first and last 15 minutes excluded as warmup/cooldown. Config
counts exclude seeds.</p>

<p>Transactions retry (10x) immediately rather than backing off, since the workload
submits transactions at a steady rate. By default, Iceberg transactions retry 4
times with an <a href="https://github.com/apache/iceberg/blob/apache-iceberg-1.10.1/core/src/main/java/org/apache/iceberg/SnapshotProducer.java#L431">exponential
backoff</a>
that starts at 100ms, doubling up to 1 minute between attempts (max 30 minutes).
This would be strictly worse than the “immediate retry” strategy for this
workload.</p>

<p><strong>Note</strong>: Each set of heatmaps often includes more than the two displayed by
default. Click on an image to view the gallery and flip through them. The full
set of plots is also <a href="/files/2026-catalog-plots.zip">here</a>.</p>

<h2 id="1a-single-table-fastappend-fa-workload">1a. Single table, FastAppend (FA) workload</h2>
<p><a id="exp1"></a></p>

<p>In this workload, we have a single table and only FastAppend transactions. The
catalog is “instant” with a fixed latency of 1ms. If we’re assuming clients
follow the protocol as specified, then the only bottleneck should be the cost of
preparing retries.</p>

<figure class="half ">


    <a href="/images/2026/03/catalog/exp1_fa_baseline/success_vs_throughput.png" class="glightbox" data-gallery="exp1_fa_baseline-single-table-transactions-with-only-trivial-conflicts" data-description="Success rate vs throughput for single-table FastAppend, 1ms catalog. 100% success up to 0.8 c/s; 99.9% at 2.0 c/s; 91% at 3.7 c/s; 57% at 4.6 c/s; collapses to 14% at 5.7 c/s.">
      <img src="/images/2026/03/catalog/exp1_fa_baseline/success_vs_throughput.png" alt="Success rate vs throughput for single-table FastAppend, 1ms catalog. 100% success up to 0.8 c/s; 99.9% at 2.0 c/s; 91% at 3.7 c/s; 57% at 4.6 c/s; collapses to 14% at 5.7 c/s." />
    </a>


    <a href="/images/2026/03/catalog/exp1_fa_baseline/latency_vs_throughput_annotated.png" class="glightbox" data-gallery="exp1_fa_baseline-single-table-transactions-with-only-trivial-conflicts" data-description="P50, P95, P99 commit latency vs throughput for single-table FastAppend. P50 rises from 410ms at low load to ~1.3s at saturation. P95 and P99 climb steeply, converging near 2.4/2.6s. Annotations show success rates declining: 99.9%, 91%, 57%, 31%, 14%.">
      <img src="/images/2026/03/catalog/exp1_fa_baseline/latency_vs_throughput_annotated.png" alt="P50, P95, P99 commit latency vs throughput for single-table FastAppend. P50 rises from 410ms at low load to ~1.3s at saturation. P95 and P99 climb steeply, converging near 2.4/2.6s. Annotations show success rates declining: 99.9%, 91%, 57%, 31%, 14%." />
    </a>


    <figcaption><ol>
  <li>Single-table transactions with only trivial conflicts</li>
</ol>
</figcaption>
  
</figure>

<figure>

  <table>
    <thead>
      <tr>
        <th>Throughput (c/s)</th>
        <th>Success Rate (%)</th>
        <th>P50 Latency (s)</th>
        <th>P95 Latency (s)</th>
        <th>P99 Latency (s)</th>
        <th>Mean Retries</th>
      </tr>
    </thead>
    <tbody>
      <tr>
        <td>0.2 ± 0.0</td>
        <td>100.0 ± 0.0</td>
        <td>0.41 ± 0.00</td>
        <td>0.56 ± 0.00</td>
        <td>0.69 ± 0.05</td>
        <td>1.0</td>
      </tr>
      <tr>
        <td>0.4 ± 0.0</td>
        <td>100.0 ± 0.0</td>
        <td>0.42 ± 0.00</td>
        <td>0.65 ± 0.01</td>
        <td>0.79 ± 0.03</td>
        <td>1.1</td>
      </tr>
      <tr>
        <td>0.8 ± 0.0</td>
        <td>100.0 ± 0.0</td>
        <td>0.43 ± 0.00</td>
        <td>0.73 ± 0.02</td>
        <td>0.97 ± 0.05</td>
        <td>1.2</td>
      </tr>
      <tr>
        <td>1.6 ± 0.0</td>
        <td>99.9 ± 0.0</td>
        <td>0.46 ± 0.00</td>
        <td>1.01 ± 0.01</td>
        <td>1.43 ± 0.05</td>
        <td>1.6</td>
      </tr>
      <tr>
        <td><strong>2.0 ± 0.0</strong></td>
        <td><strong>99.9 ± 0.0</strong></td>
        <td><strong>0.50 ± 0.00</strong></td>
        <td><strong>1.23 ± 0.05</strong></td>
        <td><strong>1.81 ± 0.06</strong></td>
        <td><strong>1.8</strong></td>
      </tr>
      <tr>
        <td>2.7 ± 0.0</td>
        <td>99.0 ± 0.2</td>
        <td>0.60 ± 0.01</td>
        <td>1.61 ± 0.02</td>
        <td>2.20 ± 0.04</td>
        <td>2.4</td>
      </tr>
      <tr>
        <td>3.7 ± 0.0</td>
        <td>91.2 ± 0.3</td>
        <td>0.84 ± 0.01</td>
        <td>2.20 ± 0.02</td>
        <td>2.55 ± 0.02</td>
        <td>3.6</td>
      </tr>
      <tr>
        <td>4.6 ± 0.0</td>
        <td>56.5 ± 0.2</td>
        <td>1.16 ± 0.02</td>
        <td>2.38 ± 0.01</td>
        <td>2.60 ± 0.01</td>
        <td>4.8</td>
      </tr>
      <tr>
        <td>5.1 ± 0.0</td>
        <td>31.4 ± 0.1</td>
        <td>1.28 ± 0.01</td>
        <td>2.40 ± 0.00</td>
        <td>2.60 ± 0.00</td>
        <td>5.2</td>
      </tr>
      <tr>
        <td>5.7 ± 0.0</td>
        <td>13.8 ± 0.1</td>
        <td>1.33 ± 0.01</td>
        <td>2.40 ± 0.00</td>
        <td>2.58 ± 0.01</td>
        <td>5.4</td>
      </tr>
    </tbody>
  </table>

  <figcaption>Single-table, FastAppend (FA) workload</figcaption>
</figure>

<p>Around 2-3 commits/sec, transactions start to time out after 10 retries. Each FA
commit attempt reads the current table metadata and manifest list, writes a new
manifest list and table metadata, and submits a CAS — five S3 round-trips per
attempt, ~175ms at S3 median latencies (GET 27ms, PUT 60ms). Successful commits
therefore can’t exceed ~5.7 c/s at saturation; failures climb above 1 c/s
offered load.</p>

<p>Another way of looking at it: 20 TPS per table (50ms arrival rate) is completely
unattainable. Only 33% of transactions succeed, even in this rosy setting.</p>

<p><strong>Takeaway</strong>: the most optimistic single-table transaction rate is low (2-3
commits/sec), dominated by the cost of reading, merging, and writing metadata in
the object store.</p>

<h2 id="1b-single-table-mixed-workload-fastappend-fa-validatedoverwrite-vo">1b. Single table, mixed workload (FastAppend (FA), ValidatedOverwrite (VO))</h2>
<p><a id="exp2"></a></p>

<p>In this experiment, the arrival rate is shared for a mix of FastAppend and
ValidatedOverwrite transactions. The ratio of FA to VO transactions
(<code class="language-plaintext highlighter-rouge">fast_append_ratio</code>) on the y-axis is swept from 1.0 (all FA) down to 0.0 (all
VO). The same arrival rates are swept as the previous experiment, with the same,
“instant” catalog. The 1.0 row is the same configuration as in experiment 1a,
but with different seeds.</p>

<figure class="half ">


    <a href="/images/2026/03/catalog/exp2_mix_heatmap/heatmap_fa_success_rate.png" class="glightbox" data-gallery="exp2_mix_heatmap_success-1b-single-table-fastappend-fa-validatedoverwrite-vo-success-rates" data-description="Heatmap of FA success rate by inter-arrival time (x, 20-5000ms) and FA ratio (y, 0.1-1.0). At 20ms, FA success ranges from 15% (FA=1.0) to 34% (FA=0.1) as fewer FA transactions compete. At 200ms, 92-96%; at 500ms+, all ratios reach 100%.">
      <img src="/images/2026/03/catalog/exp2_mix_heatmap/heatmap_fa_success_rate.png" alt="Heatmap of FA success rate by inter-arrival time (x, 20-5000ms) and FA ratio (y, 0.1-1.0). At 20ms, FA success ranges from 15% (FA=1.0) to 34% (FA=0.1) as fewer FA transactions compete. At 200ms, 92-96%; at 500ms+, all ratios reach 100%." />
    </a>


    <a href="/images/2026/03/catalog/exp2_mix_heatmap/heatmap_vo_success_rate.png" class="glightbox" data-gallery="exp2_mix_heatmap_success-1b-single-table-fastappend-fa-validatedoverwrite-vo-success-rates" data-description="Heatmap of VO success rate by inter-arrival time and FA ratio. VO is far more sensitive: near 0-13% at 20ms for high FA ratios. At 100ms, ranges from 35% (FA=0.9) to 55% (FA=0.0). Requires 300ms+ inter-arrival for 97%+ success.">
      <img src="/images/2026/03/catalog/exp2_mix_heatmap/heatmap_vo_success_rate.png" alt="Heatmap of VO success rate by inter-arrival time and FA ratio. VO is far more sensitive: near 0-13% at 20ms for high FA ratios. At 100ms, ranges from 35% (FA=0.9) to 55% (FA=0.0). Requires 300ms+ inter-arrival for 97%+ success." />
    </a>


    <figcaption>1b. Single-table, FastAppend (FA)/ValidatedOverwrite (VO) Success rates
</figcaption>
  
</figure>

<p>Unsurprisingly, FastAppend transactions are more likely to commit as the mix
includes more ValidatedOverwrite transactions; retrying a FA transaction is
cheaper. However, as with a mix of 90% FastAppend and 10% ValidatedOverwrite
transactions, the maximum sustainable arrival rate drops to around <strong>2
commits/sec</strong>.</p>

<p>We’ll continue to measure FA-only as a baseline, but I’d argue that VO
throughput is the “real” sustainable commit rate per table, following the
protocol as specified. Higher rates require coordination outside the table
format protocol; only participating writers (i.e., the catalog operator’s
writers) get reliable commit latencies.</p>

<figure class="half ">


    <a href="/images/2026/03/catalog/exp2_mix_heatmap/xheatmap_fa_mean_latency.png" class="glightbox" data-gallery="exp2_mix_heatmap_mean_latency-1b-single-table-fastappend-fa-validatedoverwrite-vo-latency" data-description="Heatmap of FA mean commit latency by inter-arrival time and FA ratio. Dominated by arrival rate: ~1340ms at 20ms inter-arrival, ~425ms at 5000ms. FA ratio has little effect. Hatched cells where success is below 95% or 80%.">
      <img src="/images/2026/03/catalog/exp2_mix_heatmap/xheatmap_fa_mean_latency.png" alt="Heatmap of FA mean commit latency by inter-arrival time and FA ratio. Dominated by arrival rate: ~1340ms at 20ms inter-arrival, ~425ms at 5000ms. FA ratio has little effect. Hatched cells where success is below 95% or 80%." />
    </a>


    <a href="/images/2026/03/catalog/exp2_mix_heatmap/xheatmap_vo_mean_latency.png" class="glightbox" data-gallery="exp2_mix_heatmap_mean_latency-1b-single-table-fastappend-fa-validatedoverwrite-vo-latency" data-description="Heatmap of VO mean commit latency by inter-arrival time and FA ratio. Reaches tens of seconds at high contention but is largely insensitive to FA ratio at a given arrival rate. Nearly all high-load cells are hatched (low success).">
      <img src="/images/2026/03/catalog/exp2_mix_heatmap/xheatmap_vo_mean_latency.png" alt="Heatmap of VO mean commit latency by inter-arrival time and FA ratio. Reaches tens of seconds at high contention but is largely insensitive to FA ratio at a given arrival rate. Nearly all high-load cells are hatched (low success)." />
    </a>


    <a href="/images/2026/03/catalog/exp2_mix_heatmap/xheatmap_fa_p95_latency.png" class="glightbox" data-gallery="exp2_mix_heatmap_mean_latency-1b-single-table-fastappend-fa-validatedoverwrite-vo-latency" data-description="Heatmap of FA P95 commit latency by inter-arrival time and FA ratio. Saturates near 2400ms at 20-50ms inter-arrival across all FA ratios. Falls to 550-570ms at 5000ms. Hatched at high load." style="display:none">
    </a>


    <a href="/images/2026/03/catalog/exp2_mix_heatmap/xheatmap_vo_p95_latency.png" class="glightbox" data-gallery="exp2_mix_heatmap_mean_latency-1b-single-table-fastappend-fa-validatedoverwrite-vo-latency" data-description="Heatmap of VO P95 commit latency by inter-arrival time and FA ratio. Reaches tens to hundreds of seconds at high contention. Pattern mirrors VO mean latency. Nearly all cells are hatched." style="display:none">
    </a>


    <a href="/images/2026/03/catalog/exp2_mix_heatmap/xheatmap_fa_p99_latency.png" class="glightbox" data-gallery="exp2_mix_heatmap_mean_latency-1b-single-table-fastappend-fa-validatedoverwrite-vo-latency" data-description="Heatmap of FA P99 commit latency by inter-arrival time and FA ratio. Saturates near 2580ms at 20ms inter-arrival. Falls from ~2500ms (200ms, FA=1.0) to ~690ms (5000ms, FA=0.1). Hatched at high load." style="display:none">
    </a>


    <a href="/images/2026/03/catalog/exp2_mix_heatmap/xheatmap_vo_p99_latency.png" class="glightbox" data-gallery="exp2_mix_heatmap_mean_latency-1b-single-table-fastappend-fa-validatedoverwrite-vo-latency" data-description="Heatmap of VO P99 commit latency by inter-arrival time and FA ratio. Extreme tail latencies reaching hundreds of seconds. Insensitive to FA ratio. Nearly all cells are hatched." style="display:none">
    </a>


    <figcaption>1b. Single-table, FastAppend (FA)/ValidatedOverwrite (VO) Latency
</figcaption>
  
</figure>

<p>The latency heatmaps show that VO transactions are remarkably <em>insensitive</em> to
the workload mix; there is almost no difference in p50/p95/p99 latencies for VO
transactions for a given arrival rate. Until VO transactions start to fail, even
a workload composed of 100% VO transactions looks similar to the 90/10 split.
Weird.</p>

<p>To understand why, recall that VO transactions read all the manifest lists
committed since the read snapshot to prepare a retry. The first commit attempt
needs to read about three minutes of manifest lists (180s mean txn time) to
prepare. This takes long enough that it will almost certainly fail. Its next
attempt will read fewer manifest lists- only those committed while it was
preparing- but it’s probably still too many to succeed on that attempt. When the
transaction finally commits, its retries have effectively spaced out commit
attempts, with (roughly) exponentially reduced retry work per attempt.</p>

<p>VO transaction retries form <strong>IO convoys</strong> that, in effect, order VO commit
attempts from the workload. This makes sense, but it surprised me; I wouldn’t
have anticipated the manifest list processing could be this expensive. Even with
an immediate retry, p99 commit latencies approach <em>2.5 minutes</em> at a 300ms arrival
rate.</p>

<p><strong>Takeaway</strong>: arrival rates above 2 commits/sec will make some transactions
practically uncommittable, even if we assume all conflicts are trivial to repair
and require no reads beyond the manifest list. Transactions that need to do work
proportional to the size of the conflict- no matter how minor- will form IO
convoys in settings with steady commit rates.</p>

<h2 id="2a-single-table-varied-catalog-latency">2a. Single table, varied catalog latency</h2>
<p><a id="exp3a"></a></p>

<p>Next we establish a new baseline, varying catalog latency for a single table
with only FastAppend transactions. Our goal is to understand how sensitive
success rates and latencies are to catalog latency for a single table. The
bottom row of the success heatmap (i.e., 1ms catalog latency) is the same
configuration as in experiment 1a, but with different seeds.</p>

<figure class="half ">


    <a href="/images/2026/03/catalog/exp3a_catalog_fa/heatmap_success_rate.png" class="glightbox" data-gallery="exp3a_catalog_fa-exp-2a-single-table-fastappend-only-varied-catalog-latency-success-rate-left-and-mean-latency-right-heatmaps-showing-sensitivity-to-catalog-cas-latency-1-120ms-and-inter-arrival-time" data-description="Heatmap of FA success rate by catalog CAS latency (y, 1-120ms) and inter-arrival time (x). At 200ms inter-arrival, success drops from 92% (1ms CAS) to 67% (120ms CAS). At 500ms+, all CAS latencies achieve 98-100%. At 20ms, all collapse to 9-15%.">
      <img src="/images/2026/03/catalog/exp3a_catalog_fa/heatmap_success_rate.png" alt="Heatmap of FA success rate by catalog CAS latency (y, 1-120ms) and inter-arrival time (x). At 200ms inter-arrival, success drops from 92% (1ms CAS) to 67% (120ms CAS). At 500ms+, all CAS latencies achieve 98-100%. At 20ms, all collapse to 9-15%." />
    </a>


    <a href="/images/2026/03/catalog/exp3a_catalog_fa/xheatmap_mean_latency.png" class="glightbox" data-gallery="exp3a_catalog_fa-exp-2a-single-table-fastappend-only-varied-catalog-latency-success-rate-left-and-mean-latency-right-heatmaps-showing-sensitivity-to-catalog-cas-latency-1-120ms-and-inter-arrival-time" data-description="Heatmap of FA mean commit latency by catalog CAS latency and inter-arrival time. At 5000ms inter-arrival, latency grows from 427ms (1ms CAS) to ~810ms (120ms CAS). At 20ms, all above 1.3s regardless of CAS. Hatched at high load.">
      <img src="/images/2026/03/catalog/exp3a_catalog_fa/xheatmap_mean_latency.png" alt="Heatmap of FA mean commit latency by catalog CAS latency and inter-arrival time. At 5000ms inter-arrival, latency grows from 427ms (1ms CAS) to ~810ms (120ms CAS). At 20ms, all above 1.3s regardless of CAS. Hatched at high load." />
    </a>


    <a href="/images/2026/03/catalog/exp3a_catalog_fa/xheatmap_p99_latency.png" class="glightbox" data-gallery="exp3a_catalog_fa-exp-2a-single-table-fastappend-only-varied-catalog-latency-success-rate-left-and-mean-latency-right-heatmaps-showing-sensitivity-to-catalog-cas-latency-1-120ms-and-inter-arrival-time" data-description="Heatmap of FA P99 commit latency by catalog CAS latency and inter-arrival time. At 120ms CAS, P99 saturates near 5.1s at high load, falling to 1.35s at 5000ms. At 1ms CAS, ranges from 2.58s (20ms) to 683ms (5000ms). Hatched at high load." style="display:none">
    </a>


    <figcaption>Exp 2a: Single table, FastAppend only, varied catalog latency. Success rate (left) and mean latency (right) heatmaps showing sensitivity to catalog CAS latency (1–120ms) and inter-arrival time.
</figcaption>
  
</figure>

<p>Results match intuition: the rate at which transactions start to fail is only
slightly affected by catalog latency, since the bottleneck is the cost of
preparing retries. FA-only workloads start to fail at ~2 commits/sec at 120ms
catalog latency, vs ~3 commits/sec at 1ms CAS.</p>

<p>Within an arrival rate, latency increases but retries don’t start to cause
notable differences below 80ms catalog latency.</p>

<p><strong>Takeaway</strong>: for a single table, the cost of preparing retries dominates the
bottleneck, so catalog latency has limited impact on success rates and commit
latency.</p>

<h2 id="2b-9010-favo-workload-varied-catalog-latency">2b. 90/10 FA/VO workload, varied catalog latency</h2>
<p><a id="exp3b"></a></p>

<p>Next we add ValidatedOverwrite transactions back into the mix, with a 90/10
FA/VO workload.</p>

<figure class="half ">


    <a href="/images/2026/03/catalog/exp3b_catalog_mix/heatmap_fa_success_rate.png" class="glightbox" data-gallery="exp3b_catalog_mix_success-exp-2b-single-table-90-10-fa-vo-mix-varied-catalog-latency-success-rate-heatmaps-for-fastappend-left-and-validatedoverwrite-right-across-catalog-latencies-and-inter-arrival-times" data-description="Heatmap of FA success rate in 90/10 FA/VO mix by catalog CAS latency and inter-arrival time. Similar to 2a but slightly worse: at 200ms inter-arrival, drops from 93% (1ms CAS) to 68% (120ms CAS). At 500ms+, all reach 98-100%.">
      <img src="/images/2026/03/catalog/exp3b_catalog_mix/heatmap_fa_success_rate.png" alt="Heatmap of FA success rate in 90/10 FA/VO mix by catalog CAS latency and inter-arrival time. Similar to 2a but slightly worse: at 200ms inter-arrival, drops from 93% (1ms CAS) to 68% (120ms CAS). At 500ms+, all reach 98-100%." />
    </a>


    <a href="/images/2026/03/catalog/exp3b_catalog_mix/heatmap_vo_success_rate.png" class="glightbox" data-gallery="exp3b_catalog_mix_success-exp-2b-single-table-90-10-fa-vo-mix-varied-catalog-latency-success-rate-heatmaps-for-fastappend-left-and-validatedoverwrite-right-across-catalog-latencies-and-inter-arrival-times" data-description="Heatmap of VO success rate in 90/10 mix by catalog CAS latency and inter-arrival time. Near 0% at 20-50ms for all CAS latencies. At 200ms, drops from 82% (1ms CAS) to 46% (120ms CAS). Requires 500ms+ for 100% at low CAS, 1000ms+ at 120ms CAS.">
      <img src="/images/2026/03/catalog/exp3b_catalog_mix/heatmap_vo_success_rate.png" alt="Heatmap of VO success rate in 90/10 mix by catalog CAS latency and inter-arrival time. Near 0% at 20-50ms for all CAS latencies. At 200ms, drops from 82% (1ms CAS) to 46% (120ms CAS). Requires 500ms+ for 100% at low CAS, 1000ms+ at 120ms CAS." />
    </a>


    <figcaption>Exp 2b: Single table, 90/10 FA/VO mix, varied catalog latency. Success rate heatmaps for FastAppend (left) and ValidatedOverwrite (right) across catalog latencies and inter-arrival times.
</figcaption>
  
</figure>

<p>Unsurprisingly, FA transaction success rates are almost identical to 2a
(FA-only) at all catalog latencies and inter-arrival times. At higher catalog
latencies, VO success rates degrade more rapidly, between 1-2 commits/sec. At
120ms commit latency, success rates drop earlier and more sharply, starting at 1
commit/sec and plummeting thereafter.</p>

<figure class="half ">


    <a href="/images/2026/03/catalog/exp3b_catalog_mix/xheatmap_fa_mean_latency.png" class="glightbox" data-gallery="exp3b_catalog_mix_mean_latency-exp-2b-single-table-90-10-fa-vo-mix-varied-catalog-latency-mean-latency-heatmaps-for-fastappend-left-and-validatedoverwrite-right-across-catalog-latencies-and-inter-arrival-times" data-description="Heatmap of FA mean commit latency in 90/10 mix by catalog CAS latency and inter-arrival time. Similar to 2a. At 5000ms inter-arrival, ranges from ~425ms (1ms CAS) to ~800ms (120ms CAS). Hatched at high load.">
      <img src="/images/2026/03/catalog/exp3b_catalog_mix/xheatmap_fa_mean_latency.png" alt="Heatmap of FA mean commit latency in 90/10 mix by catalog CAS latency and inter-arrival time. Similar to 2a. At 5000ms inter-arrival, ranges from ~425ms (1ms CAS) to ~800ms (120ms CAS). Hatched at high load." />
    </a>


    <a href="/images/2026/03/catalog/exp3b_catalog_mix/xheatmap_vo_mean_latency.png" class="glightbox" data-gallery="exp3b_catalog_mix_mean_latency-exp-2b-single-table-90-10-fa-vo-mix-varied-catalog-latency-mean-latency-heatmaps-for-fastappend-left-and-validatedoverwrite-right-across-catalog-latencies-and-inter-arrival-times" data-description="Heatmap of VO mean commit latency in 90/10 mix by catalog CAS latency and inter-arrival time. Reaches tens of seconds at high arrival rates across all CAS latencies. At 500ms inter-arrival, roughly ~17s regardless of CAS latency. Nearly all cells hatched.">
      <img src="/images/2026/03/catalog/exp3b_catalog_mix/xheatmap_vo_mean_latency.png" alt="Heatmap of VO mean commit latency in 90/10 mix by catalog CAS latency and inter-arrival time. Reaches tens of seconds at high arrival rates across all CAS latencies. At 500ms inter-arrival, roughly ~17s regardless of CAS latency. Nearly all cells hatched." />
    </a>


    <a href="/images/2026/03/catalog/exp3b_catalog_mix/xheatmap_fa_p99_latency.png" class="glightbox" data-gallery="exp3b_catalog_mix_mean_latency-exp-2b-single-table-90-10-fa-vo-mix-varied-catalog-latency-mean-latency-heatmaps-for-fastappend-left-and-validatedoverwrite-right-across-catalog-latencies-and-inter-arrival-times" data-description="Heatmap of FA P99 commit latency in 90/10 mix by catalog CAS latency and inter-arrival time. At 120ms CAS, P99 is ~5s at high load, falling to ~1.3s at 5000ms. At 1ms CAS, ranges from 2.58s (20ms) to ~700ms (5000ms). Hatched at high load." style="display:none">
    </a>


    <a href="/images/2026/03/catalog/exp3b_catalog_mix/xheatmap_vo_p99_latency.png" class="glightbox" data-gallery="exp3b_catalog_mix_mean_latency-exp-2b-single-table-90-10-fa-vo-mix-varied-catalog-latency-mean-latency-heatmaps-for-fastappend-left-and-validatedoverwrite-right-across-catalog-latencies-and-inter-arrival-times" data-description="Heatmap of VO P99 commit latency in 90/10 mix by catalog CAS latency and inter-arrival time. Extreme values reaching hundreds of seconds at high load. At 500ms inter-arrival, tens of seconds across CAS latencies. Nearly all cells hatched." style="display:none">
    </a>


    <figcaption>Exp 2b: Single table, 90/10 FA/VO mix, varied catalog latency. Mean latency heatmaps for FastAppend (left) and ValidatedOverwrite (right) across catalog latencies and inter-arrival times.
</figcaption>
  
</figure>

<p>Mean VO latencies are modestly higher as the catalog latency increases, but continue
to be mostly determined by the arrival rate.</p>

<p><strong>Takeaway</strong>: Catalog latency has a more pronounced, but minor effect on VO
success rates in a mixed (90/10) workload below 80ms. At rates where VO
transactions are viable (above 1s inter-arrival time), catalog latency has a
minor impact on commit latency.</p>

<h1 id="conclusions">Conclusions</h1>

<p>Single-table commit throughput is limited by the cost of preparing retries, not
by the catalog. With an unrealistically fast (1ms) catalog, FastAppend-only
workloads top out at 2-3 commits/sec; adding even 10% ValidatedOverwrite
transactions drops the sustainable rate to around 2 commits/sec. Below these
rates, catalog CAS latency adds modest per-commit overhead but does not change
the success rate. Above them, no catalog- however fast- can help.</p>

<p>The most interesting finding is that ValidatedOverwrite transactions form <strong>IO
convoys</strong> under load. Because each retry must read manifest lists proportional
to the number of snapshots committed since the read snapshot, the work to
prepare a retry grows with contention. Retries effectively serialize VO commit
attempts, with p99 latencies reaching minutes even at moderate arrival rates.
This is not a catalog bottleneck or an object store bottleneck- it is the cost
of the table format’s own metadata protocol.</p>

<p>These are optimistic results. All conflicts are trivial (no real data to
re-read), retries are immediate (no backoff), and the catalog is implausibly
fast. Real workloads include compactions, GDPR deletions, and non-trivial
overwrites that would only widen the gap. The protocol- as specified- limits
single-table commit rates to low single digits per second.</p>

<p>In the next post, we use the CAS latency distributions
<a href="/posts/2026/01/conditional">measured</a> across S3, S3 Express, Azure, and GCS
to model multi-table catalogs stored in object storage. Distributing
transactions across tables moves the bottleneck from per-table metadata I/O to
catalog contention- a bottleneck that conditional operations can address.</p>

<h1 id="correction-2026-06-09">Correction 2026-06-09</h1>

<p>The numbers in this post were regenerated on 2026-04-17 after finding some
simulator bugs, listed below. The bugs mostly cancel each other out leaving the
qualitative conclusions unchanged, but the values are slightly more pessimisitic
than in the original post. I intended to publish the updated numbers with the
next entry in this series, but it was taking too long.</p>

<ul>
  <li><strong>Per-attempt I/O cost corrected.</strong> Each commit attempt now issues
five S3 round-trips (<code class="language-plaintext highlighter-rouge">TM_read + ML_read + ML_write + TM_write + CAS</code>)
instead of three (<code class="language-plaintext highlighter-rouge">MF_write + ML_read + ML_write</code>). The old model
both double-counted a manifest-file write the protocol doesn’t
require and skipped the table-metadata read/write pair entirely.
Net effect: the per-table ceiling drops from ~7.7 c/s to <strong>5.7 c/s</strong>
at S3 medians.</li>
  <li><strong>Timing leaks removed.</strong> The CAS version check and <code class="language-plaintext highlighter-rouge">catalog.read()</code>
now both split-yield at half-RTT. Previously, the simulator allowed
the client to read the catalog state without waiting for the message
delay.</li>
  <li><strong>VO convoy double-count removed.</strong> The IO convoy was charging the
per-attempt manifest-list read twice and counting one extra historical
manifest list per attempt. With both fixed, single-table VO P99 drops
~7% (203s vs 219s).</li>
  <li><strong><code class="language-plaintext highlighter-rouge">table_metadata_inlined</code> flag corrected.</strong> A config-drift bug let
intermediate re-runs silently use inlined metadata (future work). This post
now uses non-inlined metadata, matching the original intent.</li>
  <li><strong>I/O requests are serial.</strong> The intended “up to 4 I/O operations
running in parallel” was inaccurate; the implementation ignored
this parameter and issued I/O requests serially.</li>
</ul>

<p>Overall: throughput is slightly lower, P50/P99 latencies are slightly higher. No
curve changes shape and no comparison reverses.</p>

<table>
  <thead>
    <tr>
      <th>Metric</th>
      <th style="text-align: right">Previously</th>
      <th style="text-align: right">Corrected</th>
    </tr>
  </thead>
  <tbody>
    <tr>
      <td>FA single-table throughput ceiling</td>
      <td style="text-align: right">~7.7 c/s (19% success @ 7.8 c/s)</td>
      <td style="text-align: right"><strong>5.7 c/s</strong> (14% success)</td>
    </tr>
    <tr>
      <td>FA practical ceiling (99%+ success)</td>
      <td style="text-align: right">~2.7 c/s</td>
      <td style="text-align: right"><strong>2.0 c/s</strong></td>
    </tr>
    <tr>
      <td>FA P50 at low load</td>
      <td style="text-align: right">320 ms</td>
      <td style="text-align: right"><strong>410 ms</strong></td>
    </tr>
    <tr>
      <td>FA P99 at saturation</td>
      <td style="text-align: right">1.89 s</td>
      <td style="text-align: right"><strong>2.58 s</strong></td>
    </tr>
    <tr>
      <td>VO P99 at IA=200 ms (pure VO)</td>
      <td style="text-align: right">219 s</td>
      <td style="text-align: right"><strong>203 s</strong> (convoy fixes)</td>
    </tr>
    <tr>
      <td>FA success @ 50 ms IA</td>
      <td style="text-align: right">42%</td>
      <td style="text-align: right"><strong>33%</strong></td>
    </tr>
  </tbody>
</table>

<p>“3–4 commits/sec” in the original post has been updated to “2–3 commits/sec”.
The per-attempt cost changed from “~300 ms retry” to “five S3 round-trips per
attempt, ~175 ms at S3 median latencies”.</p>

<div class="footnotes" role="doc-endnotes">
  <ol>
    <li id="fn:tinydata" role="doc-endnote">
      <p>Also some string property maps and namespaces, but it’s barely pushing kilobytes. <a href="#fnref:tinydata" class="reversefootnote" role="doc-backlink">&#8617;</a></p>
    </li>
    <li id="fn:vibesimulator" role="doc-endnote">
      <p>The state of the repository reflects what it is: an active hobby workshop. Scraps of notes, half-baked code, and uncurated history. If it makes assumptions that need correction, I want them to be easy to find. It’s not intended as a polished, “release” of anything; it’s a sandbox, but it’s generating results that make sense to me. Running these simulations takes hours, so email me if you want the data from a full run (~6GB) of these experiments and I’ll upload them. <a href="#fnref:vibesimulator" class="reversefootnote" role="doc-backlink">&#8617;</a></p>
    </li>
  </ol>
</div>]]></content><author><name>Chris Douglas</name><email>chris_douglas@berkeley.edu</email><uri>https://cdouglas.github.io</uri></author><category term="lst" /><category term="iceberg" /><summary type="html"><![CDATA[Simulating the Apache Iceberg single-table commit protocol to understand the upper bound on commit throughput.]]></summary><media:thumbnail xmlns:media="http://search.yahoo.com/mrss/" url="/2026/03/catalog/exp2_mix_heatmap/heatmap_vo_success_rate.png" /><media:content medium="image" url="/2026/03/catalog/exp2_mix_heatmap/heatmap_vo_success_rate.png" xmlns:media="http://search.yahoo.com/mrss/" /></entry><entry><title type="html">Conditional Operations in Object Stores</title><link href="/posts/2026/01/conditional" rel="alternate" type="text/html" title="Conditional Operations in Object Stores" /><published>2026-01-30T00:00:00+00:00</published><updated>2026-01-30T00:00:00+00:00</updated><id>/posts/2026/01/conditional</id><content type="html" xml:base="/posts/2026/01/conditional"><![CDATA[<h1 id="tldr">tl;dr</h1>

<p>Since S3 introduced strong(er) consistency in
<a href="https://aws.amazon.com/blogs/aws/amazon-s3-update-strong-read-after-write-consistency/">2020</a>
and conditional writes in late
<a href="https://aws.amazon.com/about-aws/whats-new/2024/08/amazon-s3-conditional-writes/">2024</a>,
table formats like Apache <a href="https://iceberg.apache.org/">Iceberg</a> can assume
stronger guarantees from object storage. Stricter consistency guarantees were
already supported by <a href="https://dl.acm.org/doi/abs/10.1145/2043556.2043571">Azure</a>
and <a href="https://docs.cloud.google.com/storage/docs/consistency">GCS</a><sup id="fnref:otherclouds" role="doc-noteref"><a href="#fn:otherclouds" class="footnote" rel="footnote">1</a></sup>.
How do conditional operations perform under load?</p>

<p>We benchmark the atomic/conditional primitives that object
stores provide across AWS S3 and <a href="https://aws.amazon.com/s3/storage-classes/express-one-zone/">S3 Express One
Zone</a>, Azure Blob
(Standard and Premium), and Google Cloud Storage.</p>

<table>
  <thead>
    <tr>
      <th>Object Store</th>
      <th>Compare-and-Set (op/s)</th>
      <th>CAS Latency (ms)</th>
      <th>Append (op/s)</th>
      <th>Append Latency (ms)</th>
    </tr>
  </thead>
  <tbody>
    <tr>
      <td><strong>GCS</strong></td>
      <td>0.8-1.4</td>
      <td>500-700</td>
      <td>–</td>
      <td>–</td>
    </tr>
    <tr>
      <td><strong>Azure (Standard)</strong></td>
      <td>9.2-10.2</td>
      <td>100-600</td>
      <td>9.2-10.2</td>
      <td>90-100</td>
    </tr>
    <tr>
      <td><strong>Azure (Premium)</strong></td>
      <td>15.3-16.6</td>
      <td>60-350</td>
      <td>11.1-11.4</td>
      <td>70-74</td>
    </tr>
    <tr>
      <td><strong>S3</strong></td>
      <td>14.7-15.3</td>
      <td>58-68</td>
      <td>–</td>
      <td>–</td>
    </tr>
    <tr>
      <td><strong>S3X</strong></td>
      <td>68.6-75.3</td>
      <td>14-26</td>
      <td>71.0-94.1</td>
      <td>14-24 (9800-10400)*</td>
    </tr>
  </tbody>
</table>

<p>*S3 Express One Zone (S3X) lazily composes appends on read; see details below.</p>

<p>See the <a href="#performance">graphs</a> for detailed throughput and latency analysis.</p>

<p>Conditional operations are useful building blocks for coordination through
storage, but object stores are not designed to be consensus systems<sup id="fnref:cornus" role="doc-noteref"><a href="#fn:cornus" class="footnote" rel="footnote">2</a></sup>.
Storage-only coordination is limited to low throughput workloads without an
intermediary service to batch and order operations.</p>

<hr />

<h1 id="conditions-for-coordination-in-storage">Conditions for Coordination in Storage</h1>

<blockquote>
  <p>I just dropped in to see what condition my condition was in</p>
</blockquote>

<p>The ostensible <a href="https://db.cs.cmu.edu/seminars/fall2025/">Future of Data
Systems</a> is a converged data lake.
Vendors build toward this vision in path-dependent ways, but table formats like
Apache <a href="https://iceberg.apache.org/">Iceberg</a> are emerging as a common substrate
for interoperability with limited (or no) coordination between systems outside
of storage.</p>

<p>In the 2010s, we pretended that eventual consistency was usable because it was
cheap. Iceberg made the elegant partition of its strongly-consistent
<a href="https://iceberg.apache.org/javadoc/1.10.1/org/apache/iceberg/catalog/Catalog.html">Catalog</a>
<a href="https://apache.github.io/iceberg/catalog/">state</a> and the eventually-consistent
object store where data and metadata files are stored. Transactions following a
pointer from the catalog accessed a fixed, immutable set of objects; the <em>only</em>
eventual state to reconcile was an object’s transition from absent to present.
From an application perspective, this is like transforming a consistency
problem- reasoning about which updates have been applied- to an availability
problem- parts of a table snapshot might be temporarily missing.</p>

<p>Modern object stores provide stronger consistency guarantees <em>and</em> atomic
operations over objects. So… is any of this useful to the design of table
formats? Let’s measure the practical limits of conditional/atomic operations in
object stores. They are the building block for
<a href="https://jepsen.io/consistency/models/linearizable">linearizable</a> swaps and
commit protocols in an open, storage‑only catalog<sup id="fnref:icebergdeprecation" role="doc-noteref"><a href="#fn:icebergdeprecation" class="footnote" rel="footnote">3</a></sup>.</p>

<!--
Concretely, conditional writes are how we turn strong consistency into a
sequence of atomic updates to tables. To understand what's possible- independent
of table format implementation- we can benchmark these operations to get an
upper bound on the goodput (i.e., useful throughput) of a storage-only catalog.
While we can use conditional operations throughout Iceberg, the catalog is small
(less than a megabyte, often far less) and updated with every transaction. If a
set of transactions conflict, then they can commit no faster than the goodput of
the catalog.
-->

<h1 id="conditional-operations">Conditional Operations</h1>

<p><a href="#performance">Skip</a> to measured results if you don’t want to read a primer on
conditional operations.</p>

<p>In a nutshell, clients updating an object provide a token from data they read
earlier to the object store, which rejects that write if the token doesn’t match
the current state. In a table format, the application coordinating the
transaction is saying, “I checked the table in state <code class="language-plaintext highlighter-rouge">x</code>. Only apply my update
if the table is still in state <code class="language-plaintext highlighter-rouge">x</code>; otherwise leave the state of the table
unchanged so I can retry, fail, or wander off forever.”</p>

<p>“Wandering off forever” is particularly important for table formats, since
concurrent transaction processors could have wildly different resource
constraints. The bloated corpse of a large, failed transaction could prevent
writers with fewer resources from making progress if they first need to clean up
the failed transaction.</p>

<p>Consider two typical Iceberg clients:
<a href="https://en.wikipedia.org/wiki/Exploding_whale">Florence</a>: a Spark job enriching
tens of terabytes of table data using hundreds of nodes and Bob: inserting
kilobytes of data from a streaming source. If Florence wanders off, nobody
thought to provision Bob with the resources to undo/redo even a fraction of
Florence’s work. Installing updates with a single, conditional operation avoids
any dependencies between uncommitted transactions that might entangle their
resources. It’s a key idea in Iceberg’s design<sup id="fnref:tachyon" role="doc-noteref"><a href="#fn:tachyon" class="footnote" rel="footnote">4</a></sup>: all work preparing a
transaction is completed outside the table before installing it at commit.</p>

<p>Three widely supported conditional operations could enable <em>linearizable</em>
updates from uncoordinated writers to a single object.</p>

<h2 id="if-absent">If-absent</h2>

<p>This is probably the most widely available conditional operation. Basically,
“write this object only if it does not already exist”. With a naming convention
for successors, one can order updates by probing for the latest version and
writing the next version in the sequence. Obvious example: if the transaction
depends on <code class="language-plaintext highlighter-rouge">objname.x</code> then attempt to write <code class="language-plaintext highlighter-rouge">objname.(x+1)</code>. Some
implementations store a recent-ish version that clients blindly overwrite in
race after a successful commit, to provide a hint for the “tail” of the
log.<sup id="fnref:olympia" role="doc-noteref"><a href="#fn:olympia" class="footnote" rel="footnote">5</a></sup></p>

<!--

Early
[enthusiasm](https://www.architecture-weekly.com/p/using-s3-but-not-the-way-you-expected)
for strong consistency built on this primitive and predicted some use -->

<p>I didn’t evaluate this operation as its performance under the synthetic
benchmark would be unrealistically pessimistic. Without retries or backoff, each
writer would require multiple round trips to discover the current version before
attempting its write. The benchmark would tell us less about the capabilities of
the object store than the efficiency of the tail-locating protocol.</p>

<h2 id="if-match">If-match</h2>

<!-- [Evaluation](#cas-compare-and-set). -->

<p>Every object is associated with a nonce that uniquely identifies the object at
that location. The implementation of a compare-and-set (CAS) is straightforward:
keep the nonce- an <em>entity tag</em> (etag;
<a href="https://docs.aws.amazon.com/AmazonS3/latest/userguide/conditional-requests.html">S3</a>
or
<a href="https://learn.microsoft.com/en-us/rest/api/storageservices/specifying-conditional-headers-for-blob-service-operations">Azure</a>)
or <em>generation</em>
(<a href="https://docs.cloud.google.com/storage/docs/request-preconditions">GCS</a>)- when
the object is read and provide it to ensure the correct version of that object
is overwritten<sup id="fnref:readconsistency" role="doc-noteref"><a href="#fn:readconsistency" class="footnote" rel="footnote">6</a></sup>. The write checksum must also protect against
partial writes (e.g., closing the stream while unwinding the stack could replace
the old version with a partially-written object).</p>

<p>The read-modify-overwrite loop makes this approach impractical as the object
gets larger; the read costs get too high. Moreover, not all stores guarantee
that concurrent readers can even <em>complete</em> the object read if it is interrupted
by an overwrite. Readers should be protected from torn reads (i.e., reading a
prefix of one version of the object and the suffix of its successor), but I’ve
heard of widely used storage systems that failed to provide this basic
protection.</p>

<h2 id="atomic-append">Atomic Append</h2>

<!-- [Evaluation](#append). -->

<p>Object stores usually warehouse immutable objects, but Azure Blob Storage and S3
Express One Zone (S3X) support appending data to an existing object<sup id="fnref:otherappend" role="doc-noteref"><a href="#fn:otherappend" class="footnote" rel="footnote">7</a></sup>.
Both implement a conditional, position-based append: the client reads the
current length of the object and attempts to write its data to that offset. As
long as it’s the same base object, an append that fails the position check can
be retried with the new length, avoiding the costs of reading and merging
required by a compare-and-set.</p>

<p>Contrast this with POSIX
<a href="https://www.man7.org/linux/man-pages/man2/open.2.html">O_APPEND</a> or
<a href="https://dl.acm.org/doi/10.1145/945445.945450">GFS</a>/<a href="https://dl.acm.org/doi/10.14778/2536222.2536234">KFS/QFS</a>
record append. When the storage service owns the ordering of atomic appends,
clients don’t need to know where the tail is when they append to an object. The
service will fill holes if clients are slow or fail (avoiding partial writes)
and assemble a contiguous object from the ragged tail of appends. Neither Azure
nor S3X implement record append.</p>

<p>Instead, both Azure and S3X supply metadata for the clients to order their own
operations. Conditional appends must match both the position and etag for the
base object and include a checksum to ensure the full write succeeds. Limits on
the size and number of appends per object apply:
<a href="https://docs.aws.amazon.com/AmazonS3/latest/userguide/directory-buckets-objects-append.html">S3X</a>
allows up to 10,000 appends up to 5GiB each;
<a href="https://learn.microsoft.com/en-us/rest/api/storageservices/append-block">Azure</a>
allows 50,000 appends up to 4MiB each.</p>

<p>Delegating append ordering to the client simplifies everything <em>except</em> the
writer. Server side: replication and concurrent reads at the tail are <em>much</em>
simpler if writes that are contiguous in the object arrive ordered. Slow or
failed appends can’t be visible to external clients, so in an implementation of
record-append: replicas need to handle cases where they disagree on the presence
or content of a particular record. Not only in recovery, but in forward
operation. Client side: readers also need to handle duplicate records. If a
write times out, the writer can’t be certain if its append was applied or not.
If the client retries, two duplicate records could be applied at distant
offsets.</p>

<p>Acknowledging the implementation complexity, the storage service can reorder
writes more efficiently than independent clients. As we’ll see in benchmarks,
position append avoids the read and merge costs of CAS, but oblivious
coordination across writers will limit its throughput.</p>

<p>Hereafter, I’ll refer to <a href="https://aws.amazon.com/s3/storage-classes/express-one-zone/">S3 Express One
Zone</a> as <strong>S3X</strong>
and Azure with Premium storage as <strong>AzureX</strong> for brevity.</p>

<h1 id="performance">Performance</h1>

<details>
  <summary>Benchmark setup (click to expand)</summary>

  <p>Throughput is measured using a
<a href="https://github.com/cdouglas/YCSB/tree/e4494c7d629d0008632005615a4a22255b50ff9c/catalog">custom</a>
<a href="https://github.com/brianfrankcooper/YCSB">YCSB</a> client wrapping each cloud's
Java SDK. The synthetic
<a href="https://github.com/cdouglas/YCSB/blob/lst/workloads/lst">workload</a> issues
conditional updates against a single, 2KiB object _without retries or backoff_
to determine upper-bound throughput.</p>

  <p>CAS operations read the full object before conditionally overwriting (reflecting
real applications that merge state). Append workloads write 256-byte chunks
until reaching 9900 appends (~2.4MiB), then reset via CAS. Measurements
were taken in mid-June 2025.</p>

  <p>To avoid intra-SDK side effects from caching, batching, and throttling, each
client runs in its own JVM/process. Throughput and latency are measured over the
time window when all JVMs ran concurrently: from the time the last client
started to the time the first client finished. All runs used Ubuntu 20.04 images
from the cloud vendor. Throughput and latency are averaged over five runs, each
running for five minutes. I did not attempt to control for diurnal patterns or
other known sources of
<a href="https://dl.acm.org/doi/10.14778/3611479.3611486">variance</a>, as we are concerned
only with the broad differences between clouds and the viability of a shared
storage architecture.</p>

  <p>The benchmark models a roughly catalog-sized object in storage. This could be
literally the Iceberg catalog, or really _any_ resource in object storage that
concurrent, conflicting transactions need to update. If we allow conditional
writes on the commit path, we want to know when they could become a bottleneck.</p>

  <p>We used the following configuration
(<a href="https://github.com/cdouglas/YCSB/tree/e4494c7d629d0008632005615a4a22255b50ff9c/catalog-bench">terraform scripts</a>):</p>

  <table>
    <thead>
      <tr>
        <th style="text-align: left">Cloud</th>
        <th style="text-align: left">VM</th>
        <th style="text-align: left">Region</th>
      </tr>
    </thead>
    <tbody>
      <tr>
        <td style="text-align: left">AWS</td>
        <td style="text-align: left">m5-4xlarge</td>
        <td style="text-align: left">us-west-2</td>
      </tr>
      <tr>
        <td style="text-align: left">Azure</td>
        <td style="text-align: left">Standard-D16s-v3</td>
        <td style="text-align: left">West US</td>
      </tr>
      <tr>
        <td style="text-align: left">GCP</td>
        <td style="text-align: left">n2-standard-16</td>
        <td style="text-align: left">us-west1</td>
      </tr>
    </tbody>
  </table>

</details>

<h2 id="cas-compare-and-set">CAS (Compare-and-Set)</h2>

<h3 id="google-cloud-storage">Google Cloud Storage</h3>

<figure class="half ">


    <a href="/images/2026/01/conditional/gcp_n2-standard-16_direct_CAS_metal_throughput_stacked_bar.png" class="glightbox" data-gallery="gcs_cas-gcs-cas-performance-throughput-left-shows-1-write-s-throttling-latency-right-averages-500-700ms" data-description="GCS CAS throughput: 1.4 op/s declining to 0.8 op/s; failed ops increasing from 0 to 1.6 unsuccessful op/s at 16 clients">
      <img src="/images/2026/01/conditional/gcp_n2-standard-16_direct_CAS_metal_throughput_stacked_bar.png" alt="GCS CAS throughput: 1.4 op/s declining to 0.8 op/s; failed ops increasing from 0 to 1.6 unsuccessful op/s at 16 clients" />
    </a>


    <a href="/images/2026/01/conditional/gcp_n2-standard-16_direct_CAS_metal_latency_vs_threads.png" class="glightbox" data-gallery="gcs_cas-gcs-cas-performance-throughput-left-shows-1-write-s-throttling-latency-right-averages-500-700ms" data-description="GCS CAS latency: starts at 700ms, drops to ~500ms with large (100ms) error bars">
      <img src="/images/2026/01/conditional/gcp_n2-standard-16_direct_CAS_metal_latency_vs_threads.png" alt="GCS CAS latency: starts at 700ms, drops to ~500ms with large (100ms) error bars" />
    </a>


    <figcaption>GCS CAS performance: throughput (left) shows ~1 write/s throttling; latency (right) averages 500-700ms
</figcaption>
  
</figure>

<p>Kudos to the team responsible for throttling single-object requests. The single
write per second limit is
<a href="https://cloud.google.com/storage/quotas#objects">documented</a>. Even the
single-client CAS latency is over 700ms, which is quite high. I wrote the GCS
team to verify that I was using the SDK correctly and had not overlooked a
storage configuration suited to this workload, but did not receive a response.</p>

<p>Given the documentation, it seems likely that this is performing as designed. I
did not modify the benchmark to use <a href="https://cloud.google.com/storage/docs/composite-objects">composite
object</a> support to
emulate append, as I assume the same limit applies.</p>

<p>A guess: versioning support probably retains multiple versions of the data, and
without throttling the system could be overwhelmed. It would be worth testing if
larger objects can be read without interruption from concurrent writes e.g., a
workload of readers starting 100ms apart, interrupted by a write every 2s. CAS
operations in Azure sometimes interrupted readers.</p>

<h3 id="azure-blob-storage">Azure Blob Storage</h3>

<figure class="half ">


    <a href="/images/2026/01/conditional/azure_Standard-D16s-v3_direct_CAS_sas_throughput_stacked_bar.png" class="glightbox" data-gallery="azure_cas-azure-cas-throughput-standard-left-sustains-10-op-s-goodput-premium-right-sustains-15-op-s-goodput" data-description="Azure CAS throughput: Steady goodput 9.2-10.7 op/s with increasing failed operations up to 36 op/s">
      <img src="/images/2026/01/conditional/azure_Standard-D16s-v3_direct_CAS_sas_throughput_stacked_bar.png" alt="Azure CAS throughput: Steady goodput 9.2-10.7 op/s with increasing failed operations up to 36 op/s" />
    </a>


    <a href="/images/2026/01/conditional/azurex_Standard-D16s-v3_direct_CAS_sas_throughput_stacked_bar.png" class="glightbox" data-gallery="azure_cas-azure-cas-throughput-standard-left-sustains-10-op-s-goodput-premium-right-sustains-15-op-s-goodput" data-description="Azure (Premium) CAS throughput: Steady goodput 14.8-16.6 op/s with increasing failed operations up to 39.1 op/s">
      <img src="/images/2026/01/conditional/azurex_Standard-D16s-v3_direct_CAS_sas_throughput_stacked_bar.png" alt="Azure (Premium) CAS throughput: Steady goodput 14.8-16.6 op/s with increasing failed operations up to 39.1 op/s" />
    </a>


    <figcaption>Azure CAS throughput: Standard (left) sustains ~10 op/s goodput; Premium (right) sustains ~15 op/s goodput
</figcaption>
  
</figure>

<p>Goodput remains steady as the rate of failed operations increases with
parallelism. Premium supports ~50% more goodput than standard storage.</p>

<p><strong>A pipeline of conditional requests is mostly waste</strong>: a successful write
invalidates all outstanding requests, so only one can succeed per round-trip.
This fundamentally restricts conditional write throughput.</p>

<figure class="half ">


    <a href="/images/2026/01/conditional/azure_Standard-D16s-v3_direct_CAS_sas_latency_vs_threads.png" class="glightbox" data-gallery="azure_cas_latency-azure-cas-latency-standard-left-and-premium-right-both-show-increasing-latency-under-contention" data-description="Azure CAS latency increasing linearly from ~100ms to ~550ms, 1-16 clients">
      <img src="/images/2026/01/conditional/azure_Standard-D16s-v3_direct_CAS_sas_latency_vs_threads.png" alt="Azure CAS latency increasing linearly from ~100ms to ~550ms, 1-16 clients" />
    </a>


    <a href="/images/2026/01/conditional/azurex_Standard-D16s-v3_direct_CAS_sas_latency_vs_threads.png" class="glightbox" data-gallery="azure_cas_latency-azure-cas-latency-standard-left-and-premium-right-both-show-increasing-latency-under-contention" data-description="Azure (Premium) CAS latency increasing linearly from ~50ms to ~350ms, 1-16 clients">
      <img src="/images/2026/01/conditional/azurex_Standard-D16s-v3_direct_CAS_sas_latency_vs_threads.png" alt="Azure (Premium) CAS latency increasing linearly from ~50ms to ~350ms, 1-16 clients" />
    </a>


    <figcaption>Azure CAS latency: Standard (left) and Premium (right) both show increasing latency under contention
</figcaption>
  
</figure>

<p>The increasing latency of successful operations in Azure is not innate to
conditional writes. The benchmark does not retry failed requests; the increase
in latency must be attributed to the store, as every client runs in its
own process.</p>

<p>Azure Blob Storage had some odd behaviors worth noting, against the advice
of my generous reviewers whose taste is otherwise impeccable.</p>

<details>
  <summary>Azure CAS anomalies (click to expand)</summary>

  <h4 id="anomalies">Anomalies</h4>

  <p>First, the length reported after a CAS is sometimes _zero_. This happens
intermittently; subsequent reads return the correct length. It's unclear if this
is a consistency issue, client bug, or a bug in my implementation, but this
(invalid) state should not be visible to clients between CAS operations.</p>

  <p>Second, CAS operations sometimes caused outstanding reads to fail, particularly
in the append workload. These errors were infrequent, but this microbenchmark is
on small data and reads of larger objects might be more susceptible to
interruption by concurrent writes.</p>

  <p>Third, throughput using SAS tokens (Shared Access Signatures that delegate 
access without exposing the storage account key) is significantly higher than the
default authentication mechanism, as shown below. At high client counts, errors
include timeouts from whatever ancillary service is authenticating requests.
Creating different SAS tokens per client has no effect on throughput, so the
throttling appears to be from the default auth service.</p>

  <figure class="half ">


    <a href="/images/2026/01/conditional/azure_Standard-D16s-v3_direct_CAS_metal_throughput_stacked_bar.png" class="glightbox" data-gallery="azure_cas_auth-azure-cas-throughput-with-default-authentication-vs-sas-tokens-standard-left-and-premium-right-show-significantly-lower-throughput-due-to-auth-service-throttling" data-description="Azure with default auth throttling goodput 8.5-3.1 op/s as clients increase">
      <img src="/images/2026/01/conditional/azure_Standard-D16s-v3_direct_CAS_metal_throughput_stacked_bar.png" alt="Azure with default auth throttling goodput 8.5-3.1 op/s as clients increase" />
    </a>


    <a href="/images/2026/01/conditional/azurex_Standard-D16s-v3_direct_CAS_metal_throughput_stacked_bar.png" class="glightbox" data-gallery="azure_cas_auth-azure-cas-throughput-with-default-authentication-vs-sas-tokens-standard-left-and-premium-right-show-significantly-lower-throughput-due-to-auth-service-throttling" data-description="Azure (Premium) with default auth throttling goodput 6.0-3.2 op/s as clients increase">
      <img src="/images/2026/01/conditional/azurex_Standard-D16s-v3_direct_CAS_metal_throughput_stacked_bar.png" alt="Azure (Premium) with default auth throttling goodput 6.0-3.2 op/s as clients increase" />
    </a>


    <figcaption>Azure CAS throughput with default authentication (vs. SAS tokens): Standard (left) and Premium (right) show significantly lower throughput due to auth service throttling
</figcaption>
  
</figure>

</details>

<h3 id="aws-s3-and-s3x">AWS: S3 and S3X</h3>

<figure class="half ">


    <a href="/images/2026/01/conditional/aws_m5-4xlarge_direct_CAS_metal_throughput_stacked_bar.png" class="glightbox" data-gallery="aws_cas-aws-cas-throughput-s3-left-sustains-15-op-s-similar-to-azure-premium-s3x-right-achieves-80-op-s-goodput-roughly-5x-higher" data-description="S3 CAS throughput steady around 15 op/s as errors increase linearly with clients">
      <img src="/images/2026/01/conditional/aws_m5-4xlarge_direct_CAS_metal_throughput_stacked_bar.png" alt="S3 CAS throughput steady around 15 op/s as errors increase linearly with clients" />
    </a>


    <a href="/images/2026/01/conditional/awsx_m5-4xlarge_direct_CAS_metal_throughput_stacked_bar.png" class="glightbox" data-gallery="aws_cas-aws-cas-throughput-s3-left-sustains-15-op-s-similar-to-azure-premium-s3x-right-achieves-80-op-s-goodput-roughly-5x-higher" data-description="S3X CAS throughput steady around 75 op/s as errors increase linearly with clients">
      <img src="/images/2026/01/conditional/awsx_m5-4xlarge_direct_CAS_metal_throughput_stacked_bar.png" alt="S3X CAS throughput steady around 75 op/s as errors increase linearly with clients" />
    </a>


    <figcaption>AWS CAS throughput: S3 (left) sustains ~15 op/s similar to Azure Premium; S3X (right) achieves ~80 op/s goodput, roughly 5x higher
</figcaption>
  
</figure>

<p>S3 CAS throughput is similar to Premium Azure Blob Storage. S3X CAS throughput
is roughly 5x what we see in any other store. Again, most of the pipeline is
wasted work (nearly 600 failed op/s!), but few Iceberg warehouses require this
kind of throughput, even across tables.</p>

<figure class="half ">


    <a href="/images/2026/01/conditional/aws_m5-4xlarge_direct_CAS_metal_latency_vs_threads.png" class="glightbox" data-gallery="aws_cas_latency-aws-cas-latency-s3-left-within-10ms-variance-s3x-right-within-12ms-variance-both-much-tighter-than-gcs-and-azure" data-description="S3 CAS latency within 58-68ms across client counts, no clear pattern">
      <img src="/images/2026/01/conditional/aws_m5-4xlarge_direct_CAS_metal_latency_vs_threads.png" alt="S3 CAS latency within 58-68ms across client counts, no clear pattern" />
    </a>


    <a href="/images/2026/01/conditional/awsx_m5-4xlarge_direct_CAS_metal_latency_vs_threads.png" class="glightbox" data-gallery="aws_cas_latency-aws-cas-latency-s3-left-within-10ms-variance-s3x-right-within-12ms-variance-both-much-tighter-than-gcs-and-azure" data-description="S3X CAS latency within 14-26ms across client counts, increasing with clients">
      <img src="/images/2026/01/conditional/awsx_m5-4xlarge_direct_CAS_metal_latency_vs_threads.png" alt="S3X CAS latency within 14-26ms across client counts, increasing with clients" />
    </a>


    <figcaption>AWS CAS latency: S3 (left) within 10ms variance; S3X (right) within 12ms variance-both much tighter than GCS and Azure
</figcaption>
  
</figure>

<p>The S3 and S3X latencies have low variance compared to GCS and Azure. Note that
the CAS latency in S3 is within 10ms and in S3X the increase in latency is
within 12ms, compared to hundreds of milliseconds separating min/max latencies
in GCS and Azure. S3X is neither general-purpose storage nor magic- it restricts
several S3 features to deliver this performance- but it delivers what it claims
on its label.</p>

<h2 id="append">Append</h2>

<p>Next, let’s measure position-based append performance. There’s a
<a href="https://dl.acm.org/doi/abs/10.1145/128765.128770">long</a>
<a href="https://dl.acm.org/doi/abs/10.1145/146941.146943">history</a> of log-structured
systems delivering high-throughput over append-only logs. Unfortunately, the
prenominate constraints on position append make high throughput
unrealizable in practice.</p>

<h3 id="azure">Azure</h3>

<figure class="half ">


    <a href="/images/2026/01/conditional/azure_Standard-D16s-v3_direct_append_sas_throughput_stacked_bar.png" class="glightbox" data-gallery="azure_append-azure-append-throughput-standard-left-and-premium-right-show-similar-patterns-to-cas-throughput" data-description="Azure append throughput: steady goodput 11 op/s, errors increasing 0-4.9 op/s">
      <img src="/images/2026/01/conditional/azure_Standard-D16s-v3_direct_append_sas_throughput_stacked_bar.png" alt="Azure append throughput: steady goodput 11 op/s, errors increasing 0-4.9 op/s" />
    </a>


    <a href="/images/2026/01/conditional/azurex_Standard-D16s-v3_direct_append_sas_throughput_stacked_bar.png" class="glightbox" data-gallery="azure_append-azure-append-throughput-standard-left-and-premium-right-show-similar-patterns-to-cas-throughput" data-description="Azure (Premium) append throughput: steady goodput 14 op/s, errors increasing 0-5.7 op/s">
      <img src="/images/2026/01/conditional/azurex_Standard-D16s-v3_direct_append_sas_throughput_stacked_bar.png" alt="Azure (Premium) append throughput: steady goodput 14 op/s, errors increasing 0-5.7 op/s" />
    </a>


    <figcaption>Azure append throughput: Standard (left) and Premium (right) show similar patterns to CAS throughput
</figcaption>
  
</figure>

<p>I’ll indulge in some <a href="https://www.youtube.com/watch?v=r-TLSBdHe1A&amp;t=1100s">eyeball
statistics</a> and call these
pretty similar to the CAS throughput graphs <a href="#azure-blob-storage">above</a>. The
same read‑modify‑write cycle applies here. Because we do not retry operations in
this benchmark, we’re not exercising the path where failed appends are retried
at the new position; including retries would make latency a noisy proxy for
retry rates.</p>

<p>For small objects, the virtues of append are not salient over CAS.</p>

<figure class="half ">


    <a href="/images/2026/01/conditional/azure_Standard-D16s-v3_direct_append_sas_latency_vs_threads.png" class="glightbox" data-gallery="azure_append_latency-azure-append-latency-standard-left-and-premium-right-show-lower-latency-than-cas-especially-under-contention" data-description="Azure append latency fairly steady 90-100ms">
      <img src="/images/2026/01/conditional/azure_Standard-D16s-v3_direct_append_sas_latency_vs_threads.png" alt="Azure append latency fairly steady 90-100ms" />
    </a>


    <a href="/images/2026/01/conditional/azurex_Standard-D16s-v3_direct_append_sas_latency_vs_threads.png" class="glightbox" data-gallery="azure_append_latency-azure-append-latency-standard-left-and-premium-right-show-lower-latency-than-cas-especially-under-contention" data-description="Azure (Premium) append latency fairly steady 71-74ms">
      <img src="/images/2026/01/conditional/azurex_Standard-D16s-v3_direct_append_sas_latency_vs_threads.png" alt="Azure (Premium) append latency fairly steady 71-74ms" />
    </a>


    <figcaption>Azure append latency: Standard (left) and Premium (right) show lower latency than CAS, especially under contention
</figcaption>
  
</figure>

<p>Latency of successful append operations is lower than CAS operations,
particularly under contention. Only one or two runs on Azure appended enough
data to reach the append limit, so we omit the interleaved CAS results.</p>

<h3 id="s3-express-one-zone-s3x">S3 Express One Zone (S3X)</h3>

<figure class="half ">


    <a href="/images/2026/01/conditional/awsx_m5-4xlarge_direct_append_metal_throughput_stacked_bar.png" class="glightbox" data-gallery="awsx_append-s3x-append-throughput-left-is-extremely-high-latency-right-shows-cas-operations-exceeding-10s" data-description="S3X append throughput: over 90 op/s goodput, errors increasing over 531 op/s at 16 clients">
      <img src="/images/2026/01/conditional/awsx_m5-4xlarge_direct_append_metal_throughput_stacked_bar.png" alt="S3X append throughput: over 90 op/s goodput, errors increasing over 531 op/s at 16 clients" />
    </a>


    <a href="/images/2026/01/conditional/awsx_m5-4xlarge_direct_append_metal_latency_vs_threads.png" class="glightbox" data-gallery="awsx_append-s3x-append-throughput-left-is-extremely-high-latency-right-shows-cas-operations-exceeding-10s" data-description="S3X append latency showing increasing update latency 12-24ms, CAS operations over 10 seconds">
      <img src="/images/2026/01/conditional/awsx_m5-4xlarge_direct_append_metal_latency_vs_threads.png" alt="S3X append latency showing increasing update latency 12-24ms, CAS operations over 10 seconds" />
    </a>


    <figcaption>S3X append: throughput (left) is extremely high; latency (right) shows CAS operations exceeding 10s
</figcaption>
  
</figure>

<p>Append throughput is a striking ~90 ops/s, but CAS latency over <strong>10 seconds</strong>?
What is going on? Breaking down the latency of the CAS operation reveals that
almost all the time is spent on the initial <em>read</em> of the object before the
conditional write.</p>

<p>As we gradually add reads into the mix (0.1%, 1%, 10%, 30%), the mean latency of
the CAS operation gradually increases as contention increases:</p>

<figure style="max-width: 50%; margin: 0 auto;">
  <img src="/images/2026/01/conditional/awsx_m5-4xlarge_direct_append_readwrite_latency_vs_threads_update.png" alt="S3X append latency breakdown with varying read percentages" style="width: 100%;" />
  <figcaption>S3X append latency breakdown: CAS latency increases as read percentage grows, revealing lazy composition behavior</figcaption>
</figure>

<p>It’s not a coincidence that the append limits in S3X match the <a href="https://docs.aws.amazon.com/AmazonS3/latest/userguide/qfacts.html">multipart
upload</a>
limits (10,000 parts of at most 5GiB each)<sup id="fnref:multipart" role="doc-noteref"><a href="#fn:multipart" class="footnote" rel="footnote">8</a></sup>. It appears that S3X
accumulates parts (not enforcing the 5MiB minimum part size) until the object is
read, and then lazily composes them into a single object. This is quite
different from Azure’s implementation, which pays this cost eagerly for each
append.</p>

<h1 id="discussion">Discussion</h1>

<!--
Finding a "modern" common denominator is not straightforward. Based on this
evaluation of three major object stores: while their conditional operations have
similar semantics, their performance can be wildly different. To be fair, almost
every abstraction in computing faces this issue. The differences and abstraction
leaks are interesting, but not insurmountable.
-->

<p>First, some basic takeaways from the benchmarks. <strong>GCS</strong> was not designed to
support this workload; the use case we’re interested in- linearizable writes on
a single, small object- is explicitly throttled below a rate that could support
even modest transaction rates. <strong>Azure</strong> Blob Storage and standard <strong>S3</strong>
sustain 10-15 conditional writes per second. The append implementations in both
<strong>Azure</strong> and <strong>S3X</strong> exhibited anomalies in correctness and performance
respectively, which complicates the implementation of optimistic protocols
directly in these object stores.</p>

<p>Immutable data objects remain the core use case for object stores, even at
premium tiers; stronger consistency and conditional operations are exciting, but
insufficient to transform object stores into consensus systems.</p>

<h2 id="position-append-is-not-really-multi-writer">Position Append is not (really) Multi-writer</h2>

<p>Adding a “record append” API to object stores would allow the client to
conditionally append not to a particular offset of a particular object, but to
the end of a particular object… wherever it is.</p>

<p>Record append is not an easy API to use well, but it can improve throughput
substantially<sup id="fnref:corfu" role="doc-noteref"><a href="#fn:corfu" class="footnote" rel="footnote">9</a></sup> and allow readers to tail the object coherently. Readers
need to tolerate duplicates and implement framing for objects larger than the
maximum append size (e.g., Azure Blob Storage’s 4MiB limit). To be fair:
evidently the state of the art in position append isn’t that easy to use well
either, at least for optimistic concurrency control.</p>

<p>To belabor a point: when a successful action invalidates all outstanding work,
conditional operations create a lot of waste under load. Azure and S3 sustain
steady throughput under contention, but as we see in these microbenchmarks,
another service needs to be in front of the object store to batch operations and
reduce conflicts to achieve higher throughput.</p>

<p>On the bright side, we can roll our own multi-writer append on top of
conditional writes.</p>

<h2 id="emulating-record-append">Emulating Record Append</h2>

<p>Any service that guarantees the durability and ordering of writes can emulate
record append on top of an object store supporting conditional writes. As in the
(inferred) implementation of S3 Express One Zone append, primitives like
<a href="https://docs.aws.amazon.com/AmazonS3/latest/userguide/mpuoverview.html">multi-part
uploads</a>
or <a href="https://cloud.google.com/storage/docs/composite-objects">composite objects</a>
in GCS can stitch together multiple writes into a single object. The trick is to
get a consistent view for readers and lazily compact to the object store,
coordinated using conditional writes.</p>

<p>AWS <a href="https://aws.amazon.com/s3/features/object-lambda/">Object Lambdas</a> can
intercept <code class="language-plaintext highlighter-rouge">GET</code>, <code class="language-plaintext highlighter-rouge">PUT</code>, and <code class="language-plaintext highlighter-rouge">LIST</code> requests to S3 objects. If writes are
funneled through a FIFO queue service like
<a href="https://docs.aws.amazon.com/AWSSimpleQueueService/latest/SQSDeveloperGuide/sqs-fifo-queues.html">SQS</a>,
an object lambda can read a checkpoint in S3 and apply the queued appends to a
particular object. On <code class="language-plaintext highlighter-rouge">GET</code> requests, the lambda replays queued writes over the
base object from S3.</p>

<p>Asynchronously, the lambda function can conditionally write the compacted object
(or append a prefix of the queue) to S3 and remove the corresponding entries
from the queue. Other instances running concurrently may return a stale view,
but never an inconsistent one. Conditional writes prevent compactions from
losing state.</p>

<p>The object lambda adds cool points for being serverless and transparent to
read-only transactions, but there’s no magic here. Clients could access the
queue directly or any service could stand in front of S3 to batch and order
writes.</p>

<h2 id="implications-for-table-formats">Implications for Table Formats</h2>

<p>So what does this mean for table formats? There are still opportunities to
reduce write amplification, particularly using append. But for coordination
through storage: any format needs to ensure real conflicts are rejected, making
the rates measured here an upper bound on throughput under contention without an
intermediary service.</p>

<p>Object stores are not (yet!) consensus systems. Data systems that use
conditional writes should relegate them to a coarse, batch primitive for
coordination, unless throughput demands are very low.</p>

<h1 id="thanks-and-blame">Thanks and Blame</h1>

<p>Thank you Joe Hellerstein, Owen O’Malley, Tiemo Bang, Natacha Crooks, and Micah
Murray for feedback on drafts. Ashvin Agrawal, Carlo Curino, Jesus Camacho
Rodriguez, and Raghu Ramakrishnan at Microsoft (Gray Systems Lab) introduced me
to table formats and helped shape many stages of a (now abandoned) research
project on Iceberg. Mehul Shah’s prophecy steered me away from several pitfalls,
except when I ignored his advice and fell into them anyway. Pavan Lanka and
Sumedh Sakdeo offered useful insights into Iceberg workloads and ORC and Parquet
internals, informing much of the work I’ll probably write about later. The
misunderstandings and errors I managed on my own.</p>

<div class="footnotes" role="doc-endnotes">
  <ol>
    <li id="fn:otherclouds" role="doc-endnote">
      <p>Also <a href="https://cloud.ibm.com/docs/cloud-object-storage?topic=cloud-object-storage-upload">IBM</a>, <a href="https://docs.oracle.com/en-us/iaas/Content/Object/Concepts/objectstorageoverview.htm">Oracle</a>, <a href="https://www.alibabacloud.com/help/en/oss/user-guide/simple-upload">Alibaba</a> <a href="#fnref:otherclouds" class="reversefootnote" role="doc-backlink">&#8617;</a></p>
    </li>
    <li id="fn:cornus" role="doc-endnote">
      <p>Cool storage disaggregation <a href="https://www.vldb.org/pvldb/vol16/p379-guo.pdf">research</a> excepted. <a href="#fnref:cornus" class="reversefootnote" role="doc-backlink">&#8617;</a></p>
    </li>
    <li id="fn:icebergdeprecation" role="doc-endnote">
      <p>The Iceberg community <a href="https://lists.apache.org/thread/oohcjfp1vpo005h2r0f6gfpsp6op0qps">deprecated</a> its shared storage catalog (<a href="https://iceberg.apache.org/javadoc/latest/org/apache/iceberg/hadoop/HadoopCatalog.html">HadoopCatalog</a>) last year, citing issues with atomicity in most storage systems. Clients now contact a catalog service to find the root of a table. Conditional writes could make a storage-only catalog possible, but we want to measure performance first to see if they are viable. <a href="#fnref:icebergdeprecation" class="reversefootnote" role="doc-backlink">&#8617;</a></p>
    </li>
    <li id="fn:tachyon" role="doc-endnote">
      <p><a href="https://dl.acm.org/doi/abs/10.1145/2670979.2670985">Tachyon</a> includes a wonderfully creative mechanism for tying recovery and priority to resource allocation. <a href="#fnref:tachyon" class="reversefootnote" role="doc-backlink">&#8617;</a></p>
    </li>
    <li id="fn:olympia" role="doc-endnote">
      <p>The <a href="https://olympiaformat.org/">Olympia</a> catalog format also experiments with this approach in S3, using hint objects. The <a href="https://iceberg.apache.org/javadoc/latest/org/apache/iceberg/hadoop/HadoopCatalog.html">HadoopCatalog</a> used a similar approach, but relied on <code class="language-plaintext highlighter-rouge">rename</code> as its atomic, if-absent operation and consistent listings to find the tail. <a href="#fnref:olympia" class="reversefootnote" role="doc-backlink">&#8617;</a></p>
    </li>
    <li id="fn:readconsistency" role="doc-endnote">
      <p>As a side-effect, including this data in Iceberg <code class="language-plaintext highlighter-rouge">InputFile</code> enforces its implicit immutability contract: if the object changes after being read, subsequent reads will fail the etag/generation check. <a href="#fnref:readconsistency" class="reversefootnote" role="doc-backlink">&#8617;</a></p>
    </li>
    <li id="fn:otherappend" role="doc-endnote">
      <p><a href="https://www.alibabacloud.com/help/en/oss/user-guide/append-upload-11">Alibaba</a> and <a href="{https://support.huaweicloud.com/intl/en-us/sdk-java-devg-obs/obs_21_0609.html">Huawei</a> also support append. <a href="#fnref:otherappend" class="reversefootnote" role="doc-backlink">&#8617;</a></p>
    </li>
    <li id="fn:multipart" role="doc-endnote">
      <p>Multi-part uploads allow clients to upload a file in chunks that remain invisible until a (destructive) complete operation combines all the parts into a single object. Parts can be reordered after upload, but once the complete operation is issued the object is immutable. <a href="#fnref:multipart" class="reversefootnote" role="doc-backlink">&#8617;</a></p>
    </li>
    <li id="fn:corfu" role="doc-endnote">
      <p>See <a href="https://dl.acm.org/doi/abs/10.1145/2535930">CORFU</a> for treatment of distributed log-based storage with record append semantics. <a href="#fnref:corfu" class="reversefootnote" role="doc-backlink">&#8617;</a></p>
    </li>
  </ol>
</div>]]></content><author><name>Chris Douglas</name><email>chris_douglas@berkeley.edu</email><uri>https://cdouglas.github.io</uri></author><category term="lst" /><category term="iceberg" /><summary type="html"><![CDATA[Benchmarking atomic operations across AWS S3/S3 Express One Zone, Azure Blob Storage (Premium), and Google Cloud Storage.]]></summary><media:thumbnail xmlns:media="http://search.yahoo.com/mrss/" url="/2026/01/conditional/aws_m5-4xlarge_direct_CAS_metal_throughput_stacked_bar.png" /><media:content medium="image" url="/2026/01/conditional/aws_m5-4xlarge_direct_CAS_metal_throughput_stacked_bar.png" xmlns:media="http://search.yahoo.com/mrss/" /></entry></feed>