Simulating Catalog and Table Conflicts
Published:
tl;dr
Update: Corrected simulations 2026-06-09
The root and leaves of table formats- catalog services and replacements for Parquet files- are getting a lot of attention in industry and academia. However, the inner nodes of table formats like Apache Iceberg limit write throughput to 1-2 commits per second, even running well-behaved workloads in optimistic conditions.
Sustained commit rates above 1-2 commits/sec are unattainable without making some transactions uncommittable.
Storage I/O is the primary bottleneck for single-table workloads, even with an unrealistically fast catalog. Catalog compare-and-set (CAS) latency up to 120ms adds only modest overhead for single-table workloads.
IO cascades extend tail latency. Conflicts requiring work proportional to the number of snapshots committed not only increase tail latency, they also create IO convoys that space out commit attempts.
Why bother?
Table formats are designed for read-dominant workloads with low update rates: non-blocking reads, atomic updates, and cheap, scalable metadata at rest. Conflict is rare by construction. If table update rates are steady, it’s usually an ingest workload with a dedicated writer and occasional conflicts caused by maintenance transactions. In multi-writer workloads, write rates are expected to be low, and an exponential backoff will probe around spikes in load.
Table format commit protocols are like an airport without a control tower. Absent coordination, either aircraft land infrequently (read-dominant workload) or each aircraft takes off knowing when it’s supposed to land (dedicated or externally coordinated writers). The table format community seems to have reached a consensus that airports must have control towers (i.e., catalog services) to sustain higher throughput. So: when do we need a control tower?
Given what we learned about the latency of conditional operations in object stores, when does the cost of resolving conflicts limit throughput for a file-based catalog? This post will focus on single-table workloads. We’ll explore multi-table catalogs and architectural alternatives in future posts.
Background: Table Formats and the Catalog
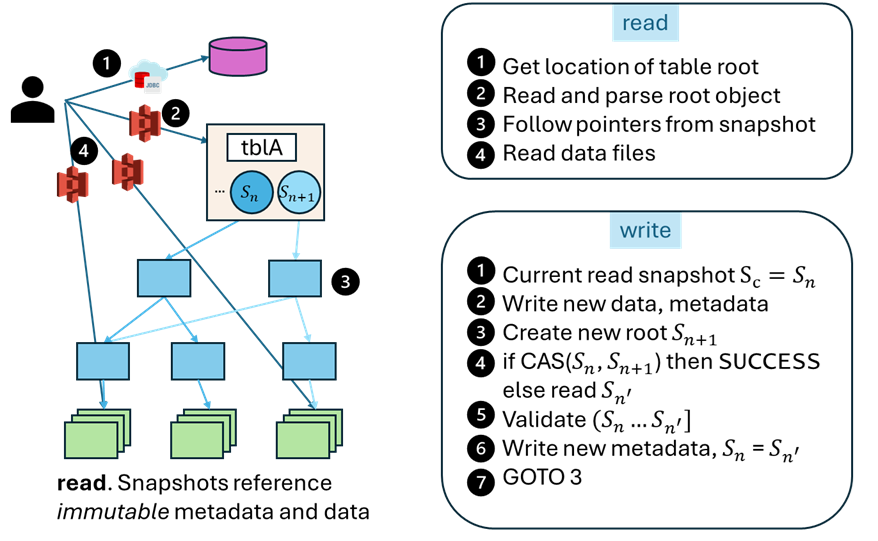
Table formats like Apache Iceberg, Apache Hudi, Delta Lake, and Lance specify conventions used by participants to ensure both that readers access consistent snapshots, and that updates to table data are ordered. Unlike traditional database systems, writers autonomously self-certify the consistency of their transaction against the current state of the table before atomically installing a new snapshot. There is no coordination across transactions outside of storage; in many settings, the set of running transactions is neither recorded nor discoverable.
Write transactions follow a coarse-grained, optimistic 3-phase lifecycle: versioned action, validation, and commit. Versioned actions track the snapshot version for reads and sequester writes outside the tree of objects reachable from the visible table. Commit is a race: transactions attempt to atomically change the current version to reflect their updates. Successful commits update the shared/visible table state; failed commits must retry after repairing their prepared transaction.
Also unlike traditional database pages, data referenced in a snapshot contains only committed data. Readers may filter tombstoned data, but a snapshot never references uncommitted data written by an active transaction.
Catalog
The Iceberg Catalog- the saddest table of all time- manages a tiny amount of state i.e., the locations of the root object for every table1. Like the root of a CoW B-tree, an update to a table shadows all affected nodes including the root.
The catalog is a natural bottleneck for concurrent transactions… right?
Yes and no. Conflicts on this pointer will cause losing transactions to verify and repair table data committed since their read snapshot. If the data files and manifest files remain valid as-written, then the transaction only needs to merge metadata references. Concretely, it must read the current table metadata (JSON blob at the root of the table; ~1MiB but potentially larger) and a subset of the manifest list(s) committed since the read snapshot (tens, multiples of ~100KiB each). The transaction merges and writes a new manifest list and table metadata, and retries the commit at the catalog.
Conflicts detected at the catalog limit throughput, but the latency of the root is not necessarily the bottleneck.
Workload Mix: FastAppend (FA) and ValidatedOverwrite (VO) Transactions
Our workload will mix “light” and “heavy” transactions from Iceberg.
A FastAppend transaction is our “light” transaction type that appends new data files and metadata (blind writes). Conflicts with other transactions are resolved by reading the table manifest and the latest manifest list, merging and writing both to create a new snapshot, then retrying the commit at the catalog.
A ValidatedOverwrite transaction is our “heavy” transaction type: an overwrite with validation enabled. It rewrites and replaces data files and metadata, so it needs to examine all the manifest lists committed between its read snapshot and the current snapshot to check for conflicts. It can then write the merged manifest list and table metadata and retry the commit at the catalog.
In what follows, we assume that all conflicts are spurious, require no reads beyond the manifest list, and failures are caused only by exhausting the retry budget at the catalog.
Simulating Commit Throughput
Using a discrete event simulator (Endive2), we can submit a transaction workload against a virtual catalog and object store. The simulator models the transaction lifecycle, including the cost of preparing retries after conflicts, and the latency of storage operations.
1a We start with an optimistic baseline: what happens to transaction throughput/latency if we use an implausibly fast catalog (1ms) and only FastAppend (light) transactions in a single table. We sweep arrival rates from 20ms (50 commits/sec) up to 5000ms (0.2 commits/sec).
1b Then we add ValidatedOverwrite (heavy) transactions into the mix. The rate a single table can sustain is lower than whatever commit rate causes these transactions to fail. By analogy, the rate at which small planes land safely is irrelevant if your airport is ringed by wrecked cargo planes that circled until they ran out of fuel. Using the same 1ms catalog, we sweep the ratio of FA (light) and VO (heavy) transactions to see how the workload mix affects success rates and latency.
2a,2b With this baseline for a single table and an instant catalog, we add another dimension: catalog latency. We sweep the compare-and-set (CAS) latency from 1ms up to 120ms. We run this sweep for both FA-only and 90/10 FA/VO workloads to measure success rate and commit latency sensitivity to catalog latency, still for a single table.
Experiment Summary
| Exp | Description | Fixed | Swept | Configs |
|---|---|---|---|---|
| 1a | FA baseline, instant catalog | 1 table, 1 group, FA=100%, instant catalog (1ms), S3, conflicts=0% | inter_arrival_scale | 10 |
| 1b | FA/VO operation mix | 1 table, 1 group, instant catalog (1ms), S3, conflicts=0% | fast_append_ratiointer_arrival_scale | 80 |
| 2a | Catalog CAS latency (FA) | 1 table, 1 group, FA=100%, S3, conflicts=0% | catalog_latency_msinter_arrival_scale | 70 |
| 2b | Catalog CAS latency (mix) | 1 table, 1 group, FA=90%/VO=10%, S3, conflicts=0% | catalog_latency_msinter_arrival_scale | 70 |
| Parameter | Values | Description |
|---|---|---|
inter_arrival_scale | [20, 50, 100, 200, 300, 400, 500, 1000, 2000, 5000] ms | Scale parameter for the exponential distribution of transaction inter-arrival times. Lower values correspond to higher transaction rates. |
fast_append_ratio | [1.0, 0.9, 0.8, 0.7, 0.5, 0.3, 0.1, 0.0] | Ratio of FastAppend (light) transactions to ValidatedOverwrite (heavy) transactions in the workload mix. 1.0 means all transactions are FastAppend, while 0.0 means all transactions are ValidatedOverwrite. |
catalog_latency_ms | [1, 5, 10, 20, 50, 80, 120] ms | Latency of the catalog’s compare-and-set (CAS) operation in milliseconds. This models the time it takes for a transaction to attempt a commit and receive a response from the catalog. |
In all experiments, the manifest list and table metadata sizes are fixed (10KiB and 100KiB, respectively). These do not use the conditional operations measured earlier, but unconditional GET and PUT operations for S3:
Latency distributions for S3 Standard (click to expand)
Distribution Parameters
GET (unconditional read)
Modeled as Lognormal(mu=ln(median), sigma), floored at min_latency_ms.
| Operation | median (ms) | sigma | min_latency (ms) |
|---|---|---|---|
| GET | 27 | 0.62 | 10 |
GET operations don’t include sizes because latency is dominated by fixed overheads at these sizes. The current simulator uses the size-based formula for PUT, but in these simulations latencies are drawn from the above lognormal distribution.
PUT (unconditional write)
Modeled as Lognormal(mu=ln(base + rate * size_MiB), sigma), floored at min_latency_ms.
| Operation | base (ms) | rate (ms/MiB) | sigma | min_latency (ms) |
|---|---|---|---|---|
| PUT | 60 | 20 | 0.29 | 10 |
Percentiles
| Operation | p5 | p10 | p25 | p50 | p75 | p90 | p95 | p99 |
|---|---|---|---|---|---|---|---|---|
| GET | 10 | 12 | 18 | 27 | 41 | 60 | 75 | 114 |
| PUT | 37 | 42 | 50 | 60 | 73 | 87 | 97 | 118 |
All experiments use 5 seeds, retry=10, txn runtime mean=180s. Each run simulates 1 hour, with the first and last 15 minutes excluded as warmup/cooldown. Config counts exclude seeds.
Transactions retry (10x) immediately rather than backing off, since the workload submits transactions at a steady rate. By default, Iceberg transactions retry 4 times with an exponential backoff that starts at 100ms, doubling up to 1 minute between attempts (max 30 minutes). This would be strictly worse than the “immediate retry” strategy for this workload.
Note: Each set of heatmaps often includes more than the two displayed by default. Click on an image to view the gallery and flip through them. The full set of plots is also here.
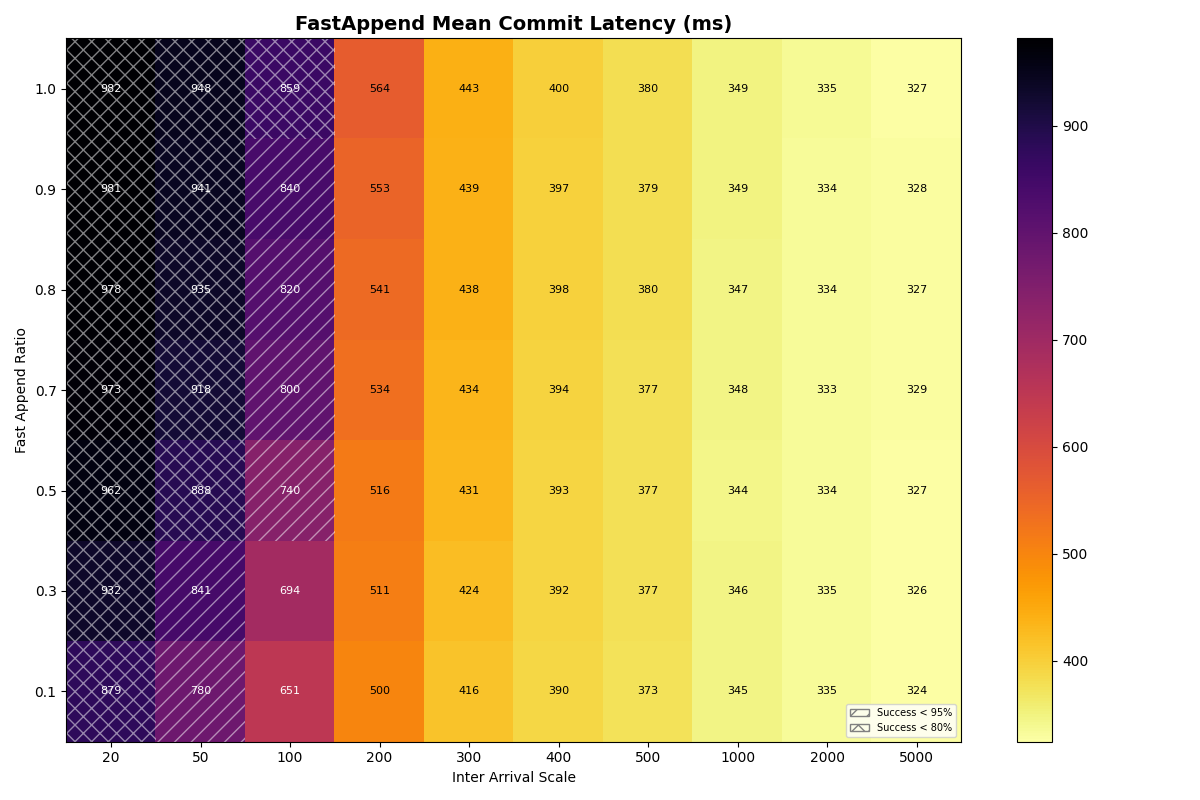
1a. Single table, FastAppend (FA) workload
In this workload, we have a single table and only FastAppend transactions. The catalog is “instant” with a fixed latency of 1ms. If we’re assuming clients follow the protocol as specified, then the only bottleneck should be the cost of preparing retries.
- Single-table transactions with only trivial conflicts
| Throughput (c/s) | Success Rate (%) | P50 Latency (s) | P95 Latency (s) | P99 Latency (s) | Mean Retries |
|---|---|---|---|---|---|
| 0.2 ± 0.0 | 100.0 ± 0.0 | 0.41 ± 0.00 | 0.56 ± 0.00 | 0.69 ± 0.05 | 1.0 |
| 0.4 ± 0.0 | 100.0 ± 0.0 | 0.42 ± 0.00 | 0.65 ± 0.01 | 0.79 ± 0.03 | 1.1 |
| 0.8 ± 0.0 | 100.0 ± 0.0 | 0.43 ± 0.00 | 0.73 ± 0.02 | 0.97 ± 0.05 | 1.2 |
| 1.6 ± 0.0 | 99.9 ± 0.0 | 0.46 ± 0.00 | 1.01 ± 0.01 | 1.43 ± 0.05 | 1.6 |
| 2.0 ± 0.0 | 99.9 ± 0.0 | 0.50 ± 0.00 | 1.23 ± 0.05 | 1.81 ± 0.06 | 1.8 |
| 2.7 ± 0.0 | 99.0 ± 0.2 | 0.60 ± 0.01 | 1.61 ± 0.02 | 2.20 ± 0.04 | 2.4 |
| 3.7 ± 0.0 | 91.2 ± 0.3 | 0.84 ± 0.01 | 2.20 ± 0.02 | 2.55 ± 0.02 | 3.6 |
| 4.6 ± 0.0 | 56.5 ± 0.2 | 1.16 ± 0.02 | 2.38 ± 0.01 | 2.60 ± 0.01 | 4.8 |
| 5.1 ± 0.0 | 31.4 ± 0.1 | 1.28 ± 0.01 | 2.40 ± 0.00 | 2.60 ± 0.00 | 5.2 |
| 5.7 ± 0.0 | 13.8 ± 0.1 | 1.33 ± 0.01 | 2.40 ± 0.00 | 2.58 ± 0.01 | 5.4 |
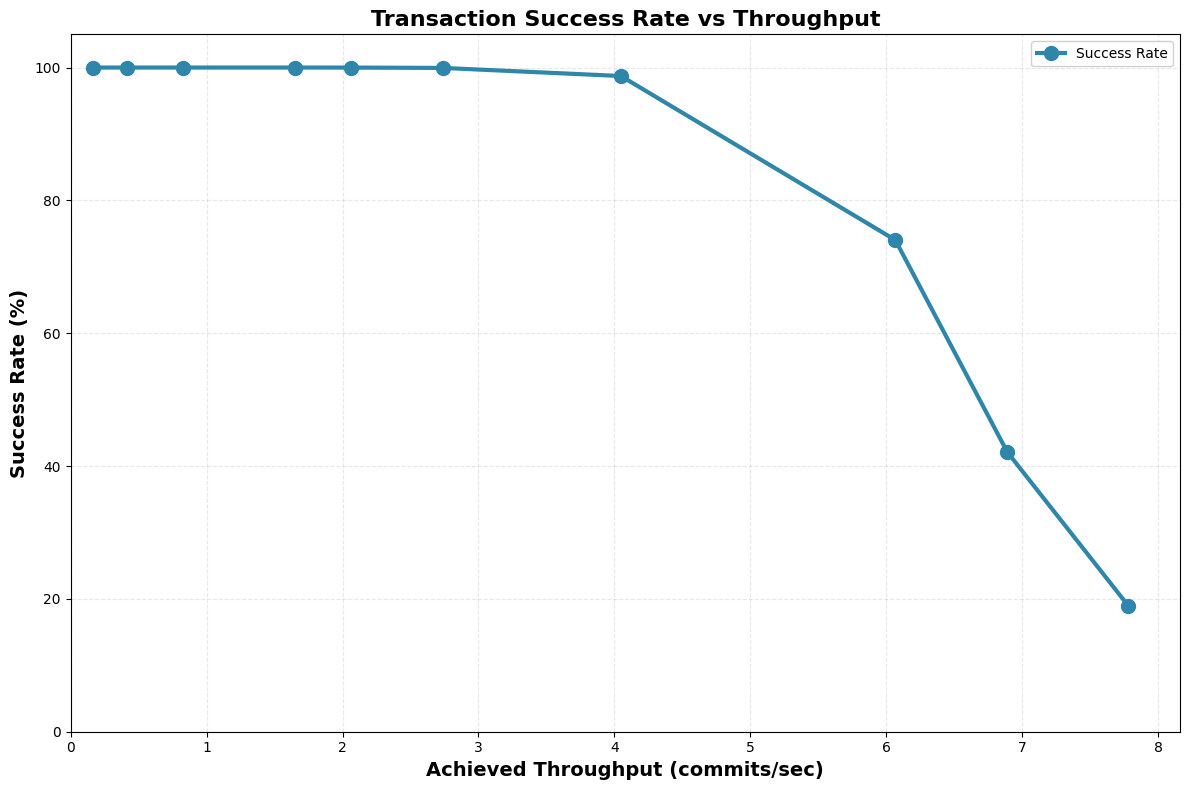
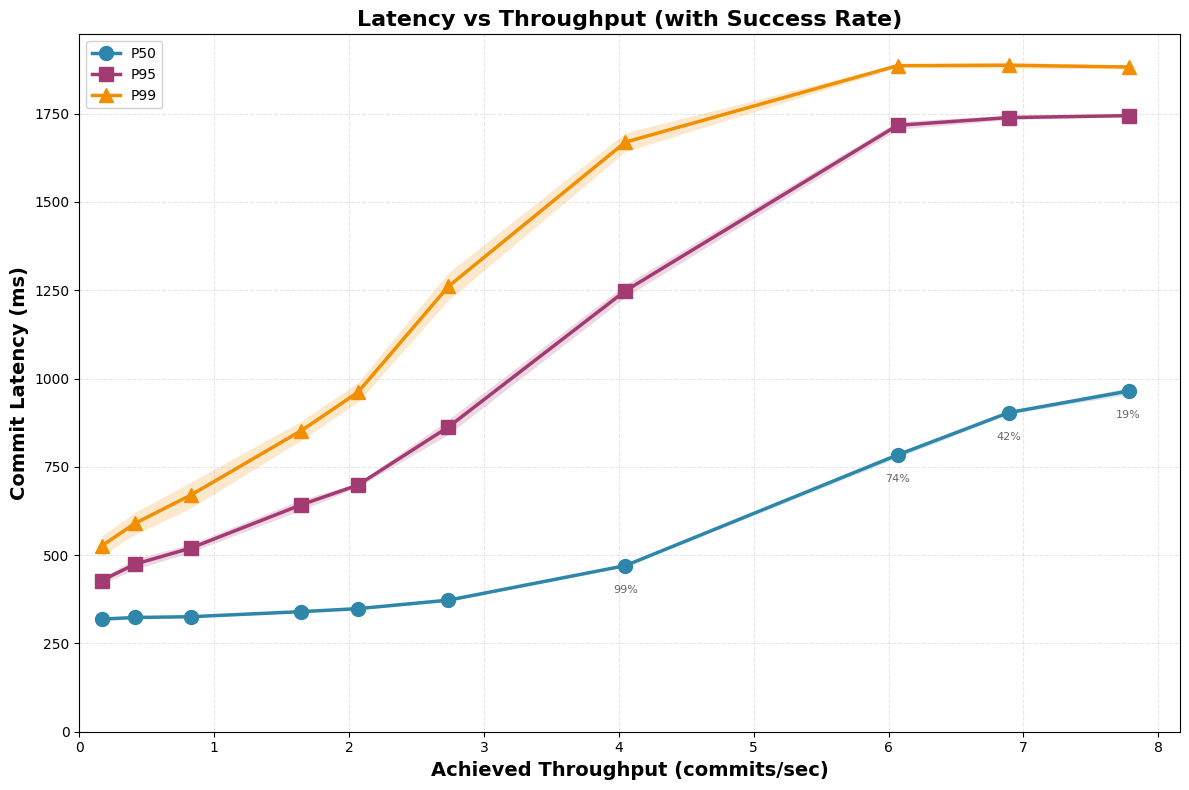
Around 2-3 commits/sec, transactions start to time out after 10 retries. Each FA commit attempt reads the current table metadata and manifest list, writes a new manifest list and table metadata, and submits a CAS — five S3 round-trips per attempt, ~175ms at S3 median latencies (GET 27ms, PUT 60ms). Successful commits therefore can’t exceed ~5.7 c/s at saturation; failures climb above 1 c/s offered load.
Another way of looking at it: 20 TPS per table (50ms arrival rate) is completely unattainable. Only 33% of transactions succeed, even in this rosy setting.
Takeaway: the most optimistic single-table transaction rate is low (2-3 commits/sec), dominated by the cost of reading, merging, and writing metadata in the object store.
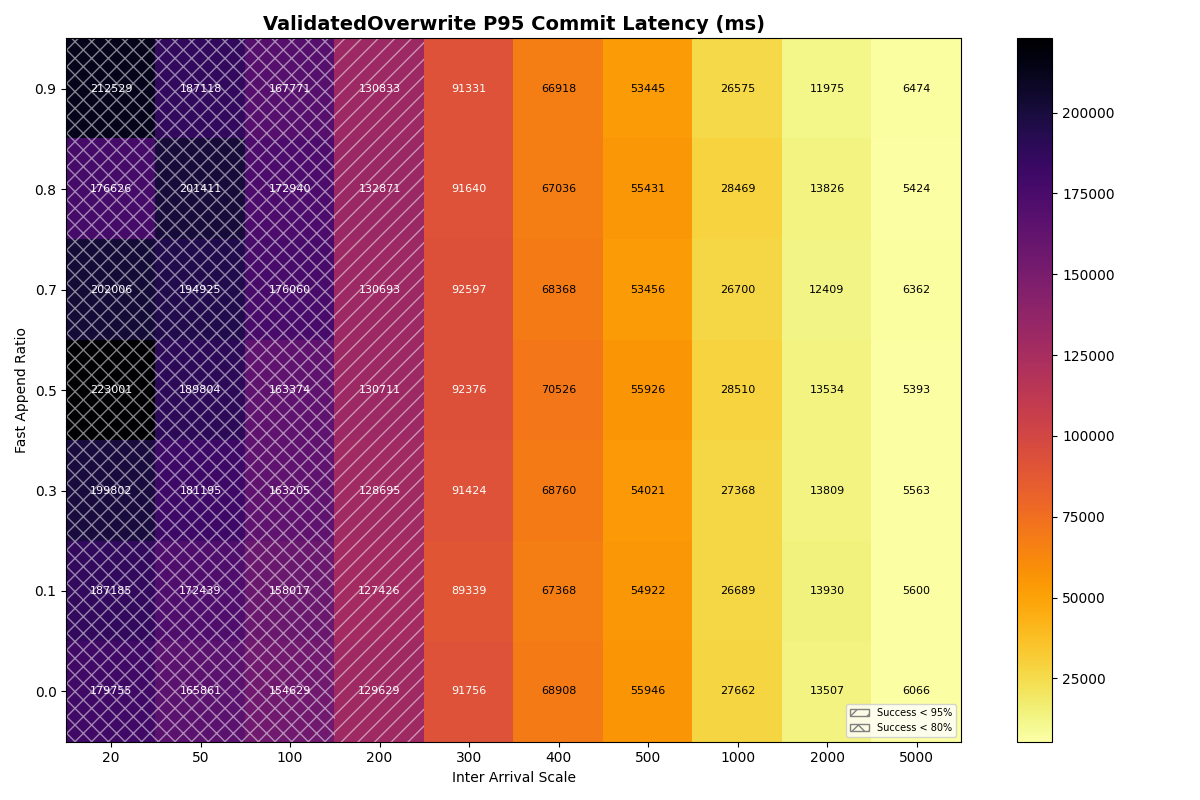
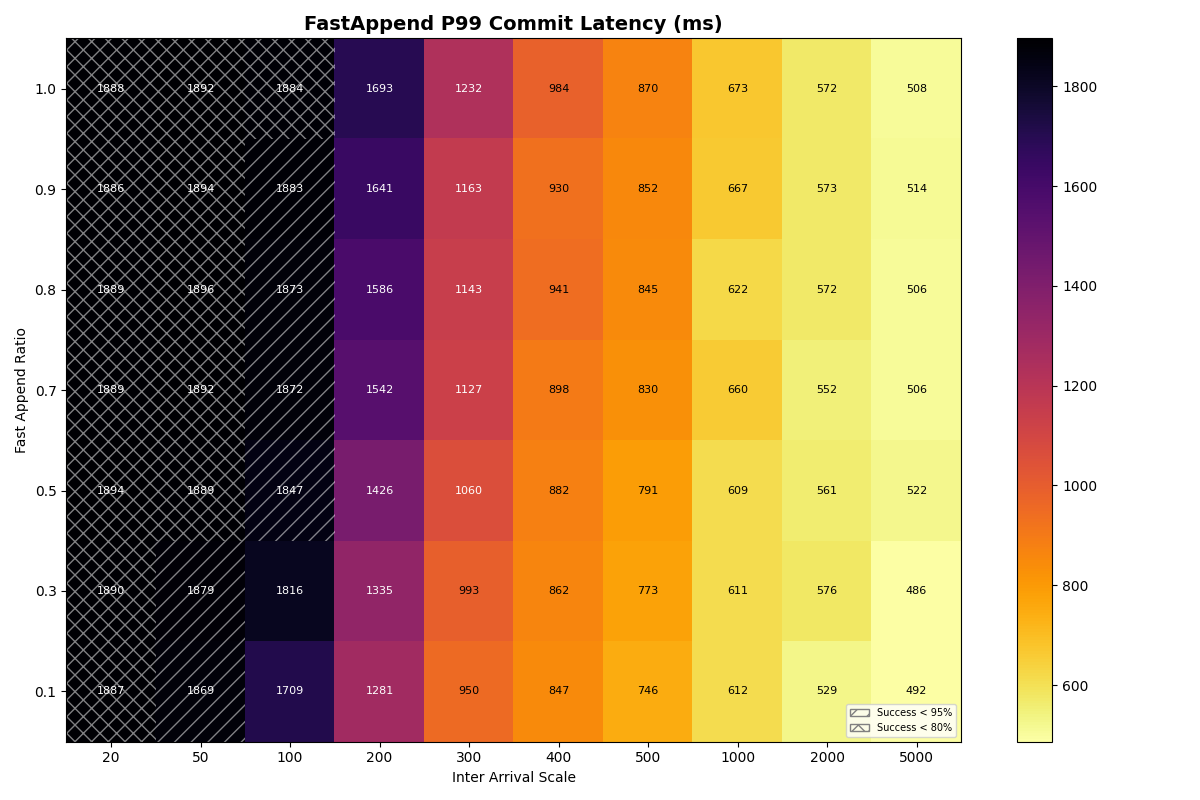
1b. Single table, mixed workload (FastAppend (FA), ValidatedOverwrite (VO))
In this experiment, the arrival rate is shared for a mix of FastAppend and ValidatedOverwrite transactions. The ratio of FA to VO transactions (fast_append_ratio) on the y-axis is swept from 1.0 (all FA) down to 0.0 (all VO). The same arrival rates are swept as the previous experiment, with the same, “instant” catalog. The 1.0 row is the same configuration as in experiment 1a, but with different seeds.
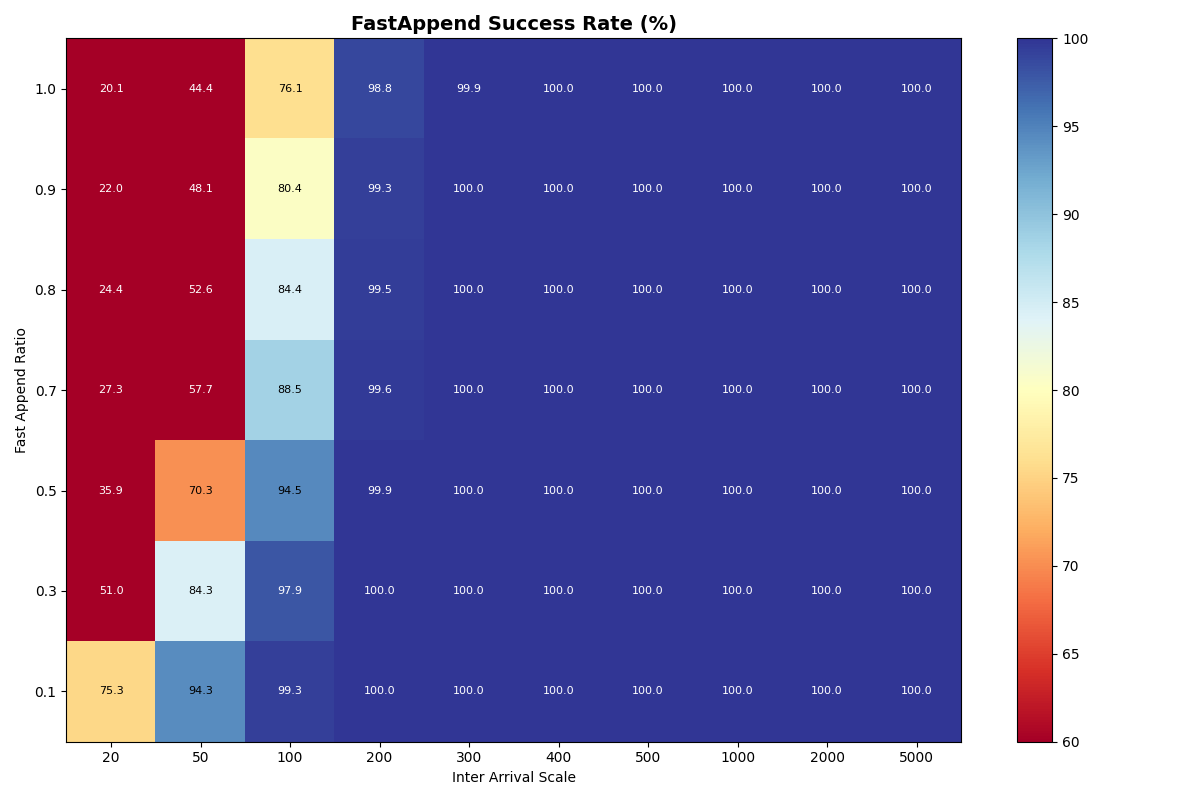
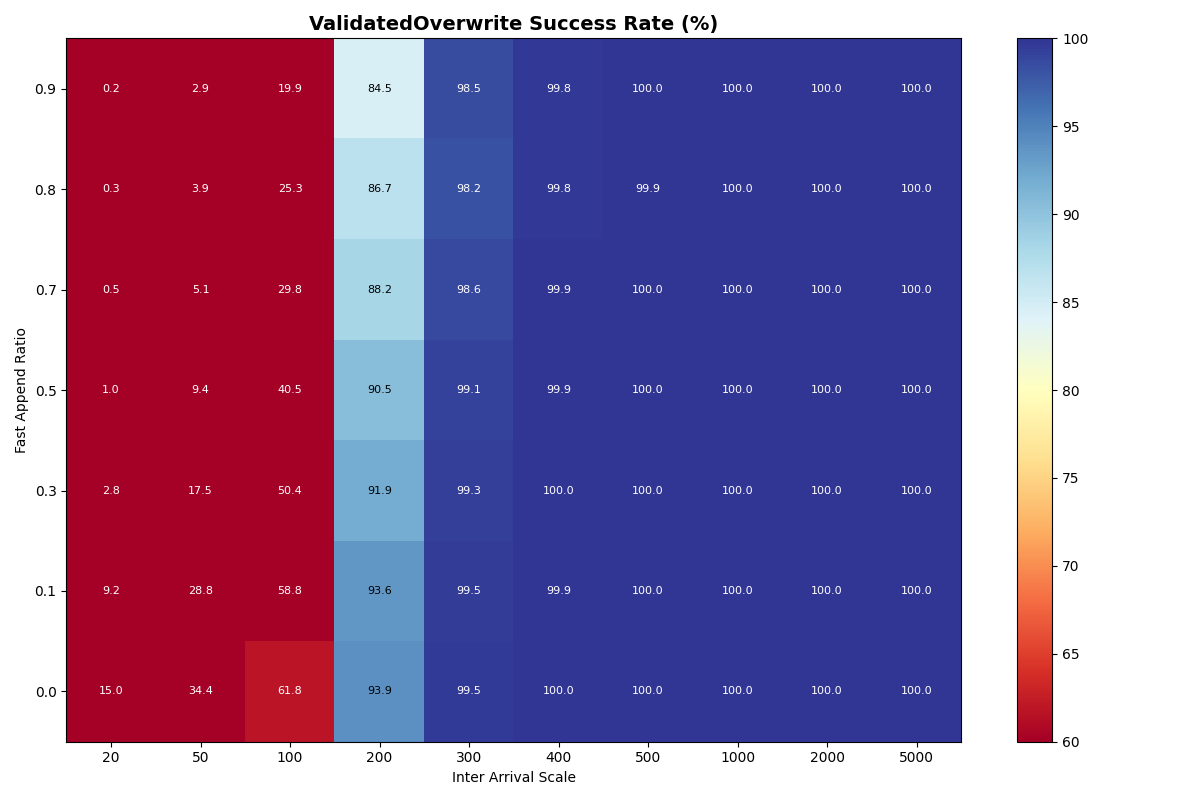
Unsurprisingly, FastAppend transactions are more likely to commit as the mix includes more ValidatedOverwrite transactions; retrying a FA transaction is cheaper. However, as with a mix of 90% FastAppend and 10% ValidatedOverwrite transactions, the maximum sustainable arrival rate drops to around 2 commits/sec.
We’ll continue to measure FA-only as a baseline, but I’d argue that VO throughput is the “real” sustainable commit rate per table, following the protocol as specified. Higher rates require coordination outside the table format protocol; only participating writers (i.e., the catalog operator’s writers) get reliable commit latencies.
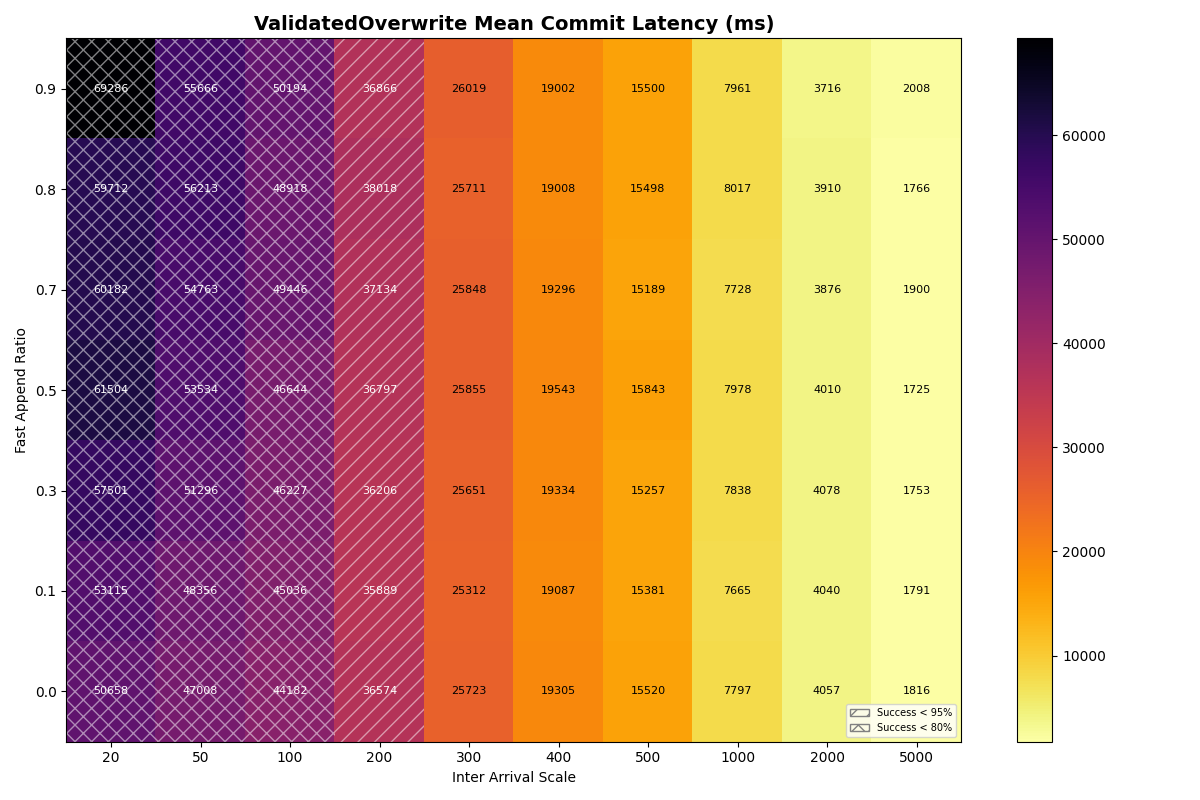
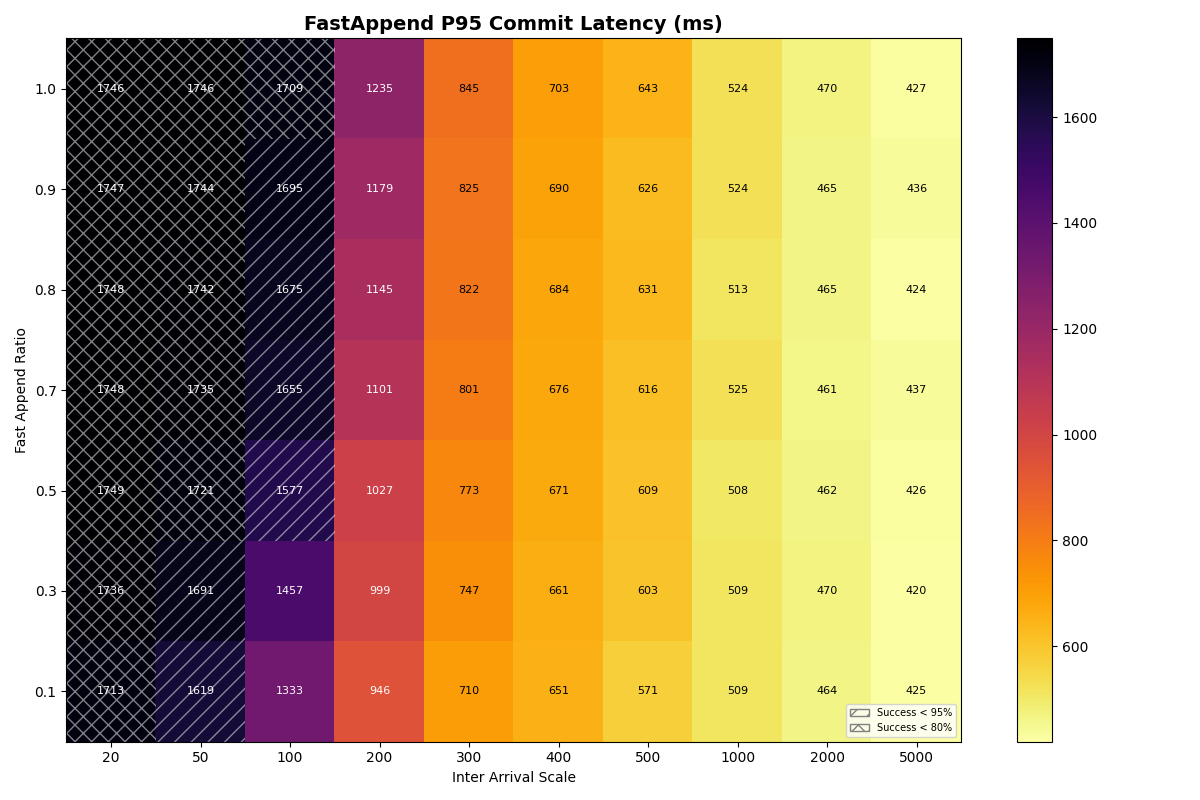
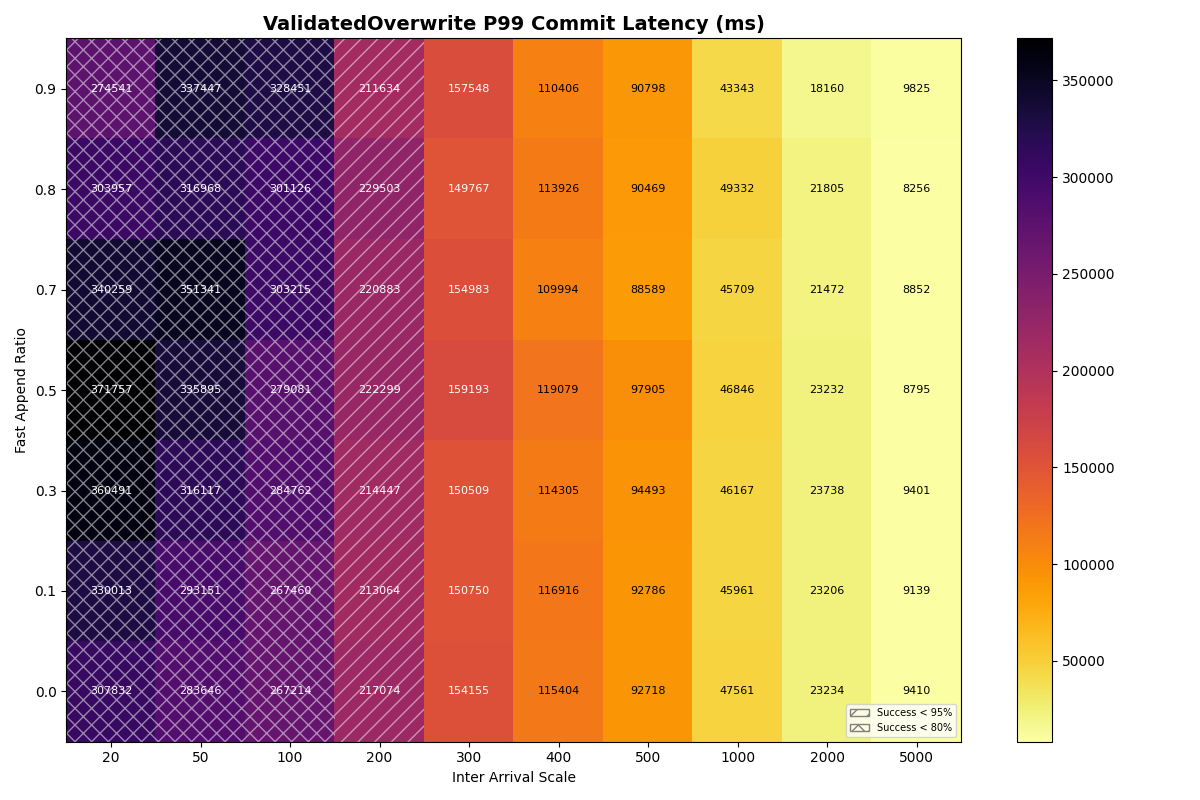
The latency heatmaps show that VO transactions are remarkably insensitive to the workload mix; there is almost no difference in p50/p95/p99 latencies for VO transactions for a given arrival rate. Until VO transactions start to fail, even a workload composed of 100% VO transactions looks similar to the 90/10 split. Weird.
To understand why, recall that VO transactions read all the manifest lists committed since the read snapshot to prepare a retry. The first commit attempt needs to read about three minutes of manifest lists (180s mean txn time) to prepare. This takes long enough that it will almost certainly fail. Its next attempt will read fewer manifest lists- only those committed while it was preparing- but it’s probably still too many to succeed on that attempt. When the transaction finally commits, its retries have effectively spaced out commit attempts, with (roughly) exponentially reduced retry work per attempt.
VO transaction retries form IO convoys that, in effect, order VO commit attempts from the workload. This makes sense, but it surprised me; I wouldn’t have anticipated the manifest list processing could be this expensive. Even with an immediate retry, p99 commit latencies approach 2.5 minutes at a 300ms arrival rate.
Takeaway: arrival rates above 2 commits/sec will make some transactions practically uncommittable, even if we assume all conflicts are trivial to repair and require no reads beyond the manifest list. Transactions that need to do work proportional to the size of the conflict- no matter how minor- will form IO convoys in settings with steady commit rates.
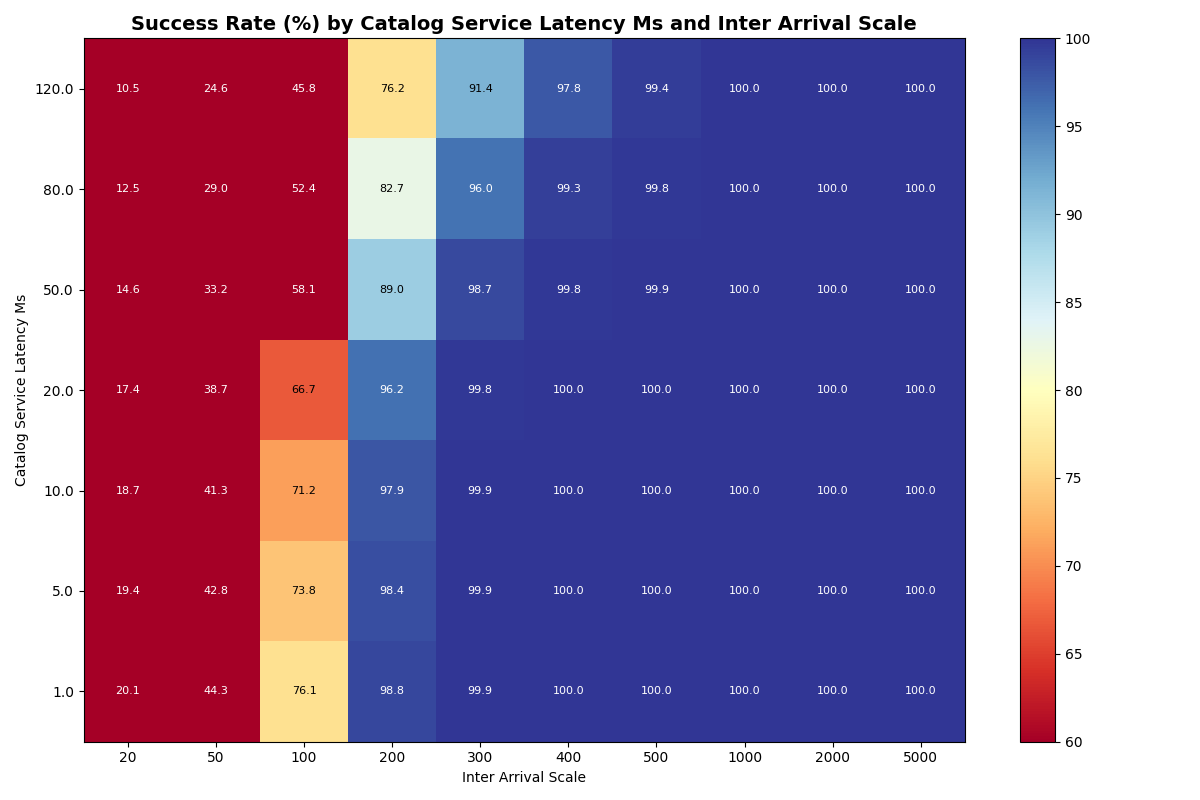
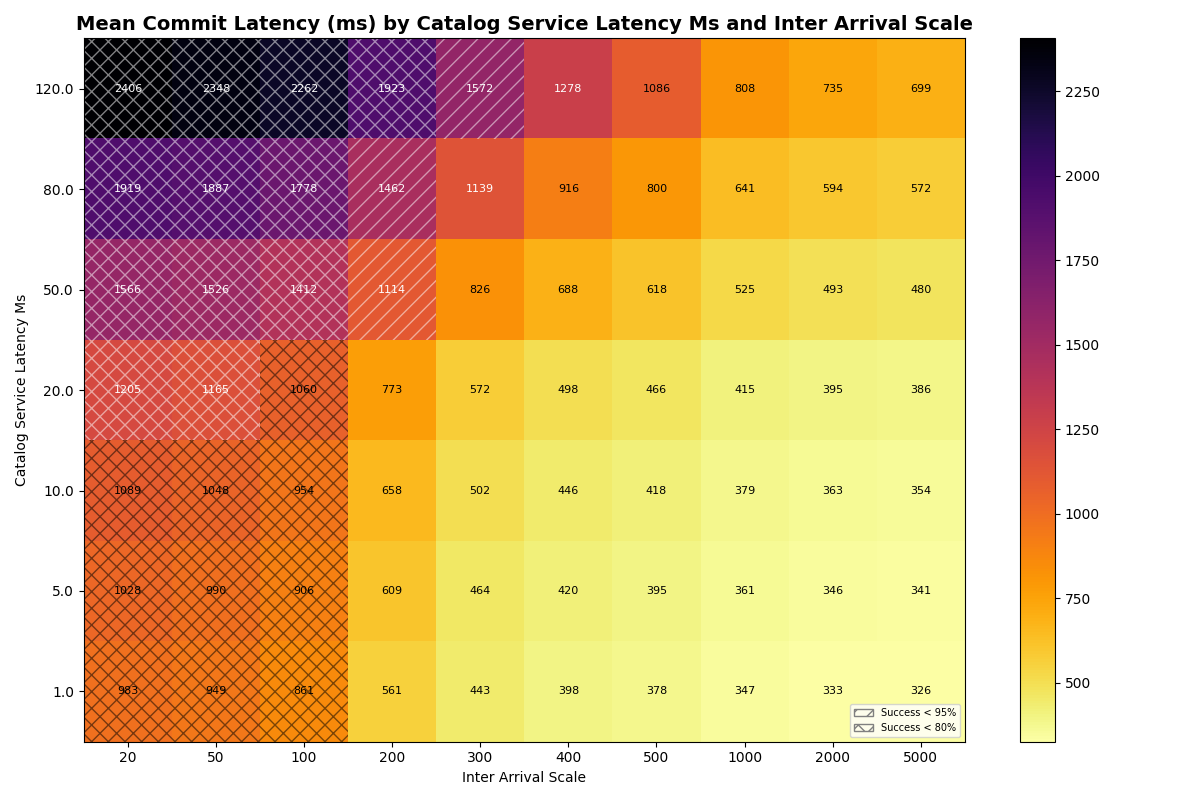
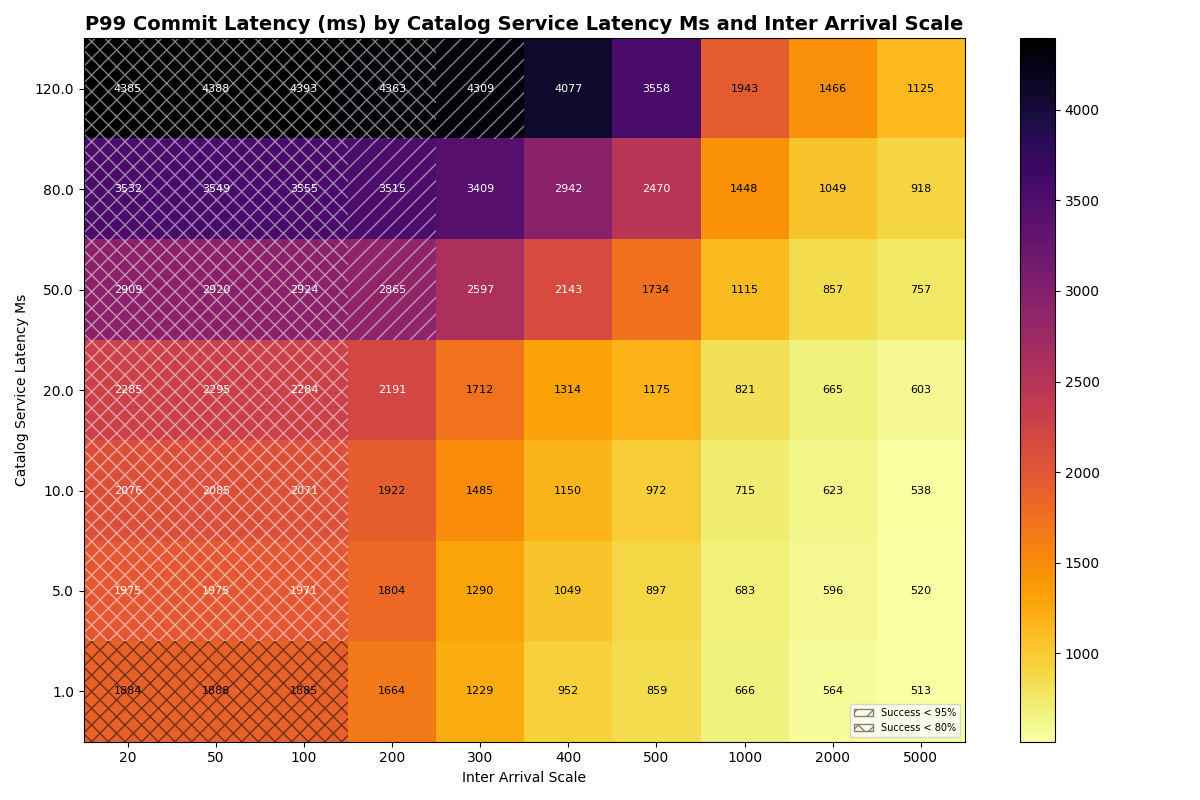
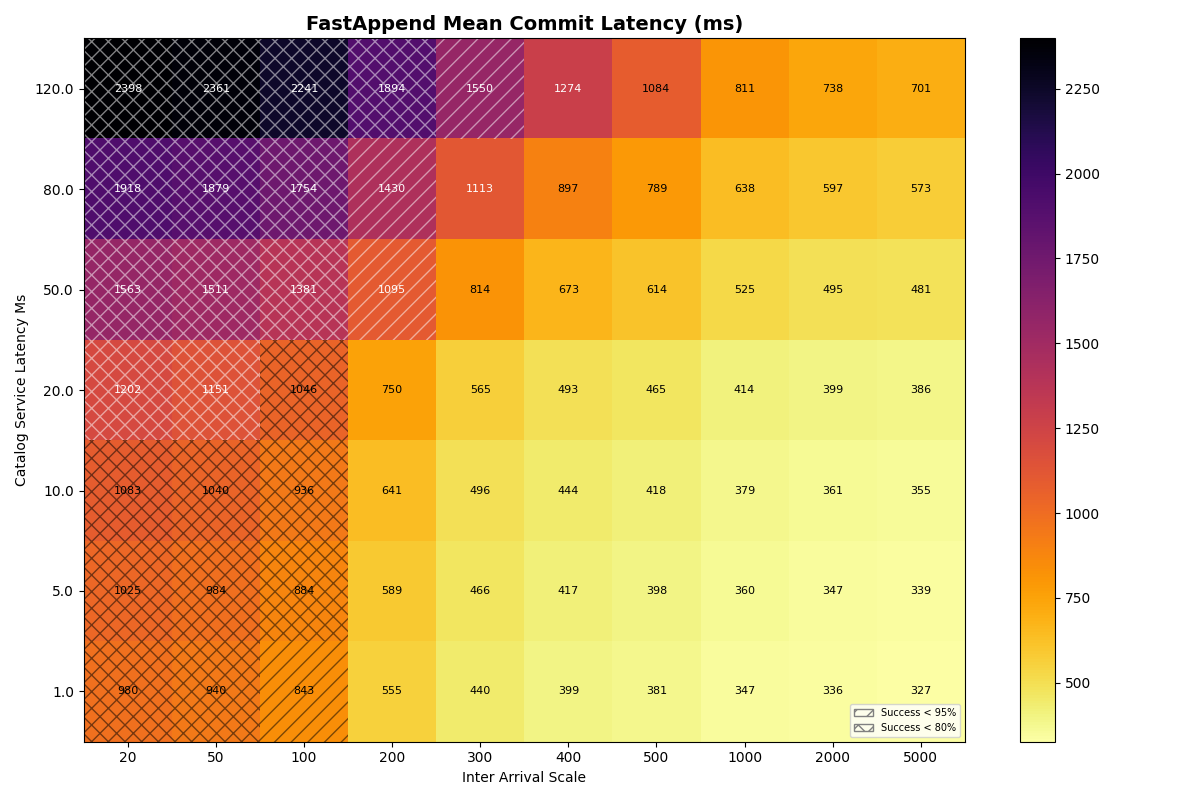
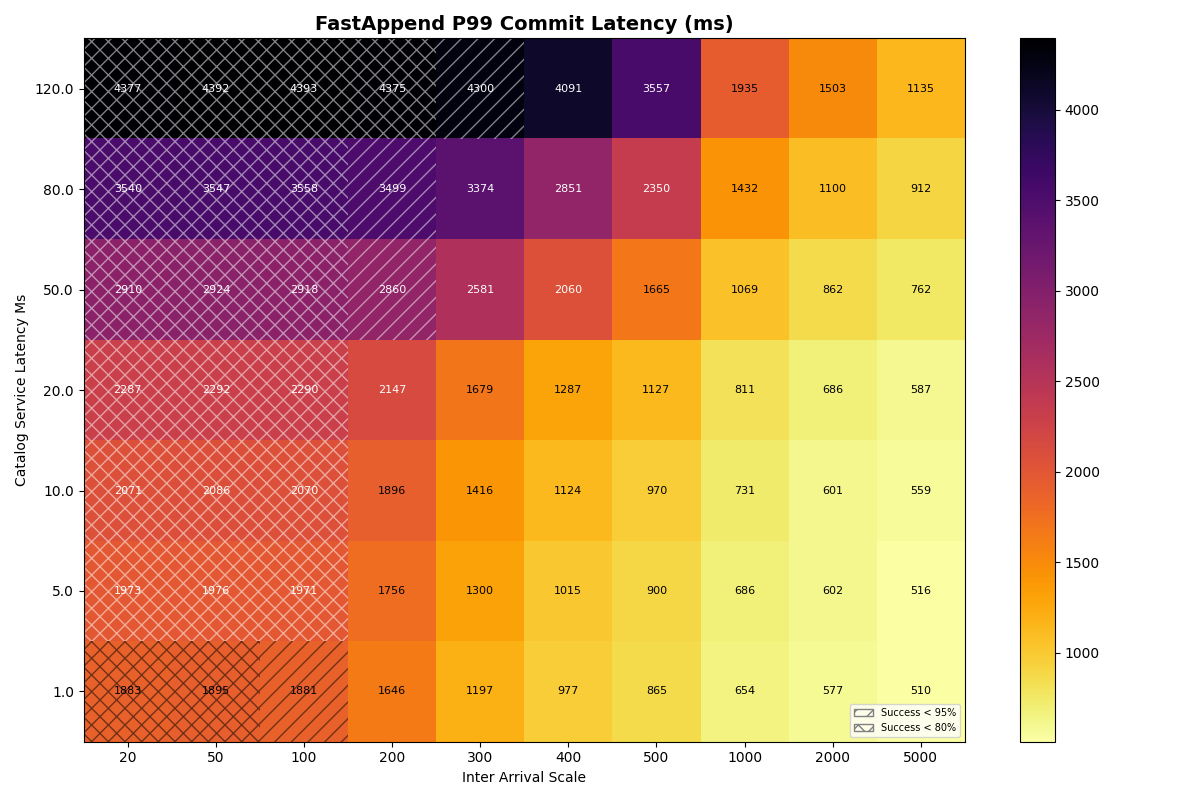
2a. Single table, varied catalog latency
Next we establish a new baseline, varying catalog latency for a single table with only FastAppend transactions. Our goal is to understand how sensitive success rates and latencies are to catalog latency for a single table. The bottom row of the success heatmap (i.e., 1ms catalog latency) is the same configuration as in experiment 1a, but with different seeds.
Results match intuition: the rate at which transactions start to fail is only slightly affected by catalog latency, since the bottleneck is the cost of preparing retries. FA-only workloads start to fail at ~2 commits/sec at 120ms catalog latency, vs ~3 commits/sec at 1ms CAS.
Within an arrival rate, latency increases but retries don’t start to cause notable differences below 80ms catalog latency.
Takeaway: for a single table, the cost of preparing retries dominates the bottleneck, so catalog latency has limited impact on success rates and commit latency.
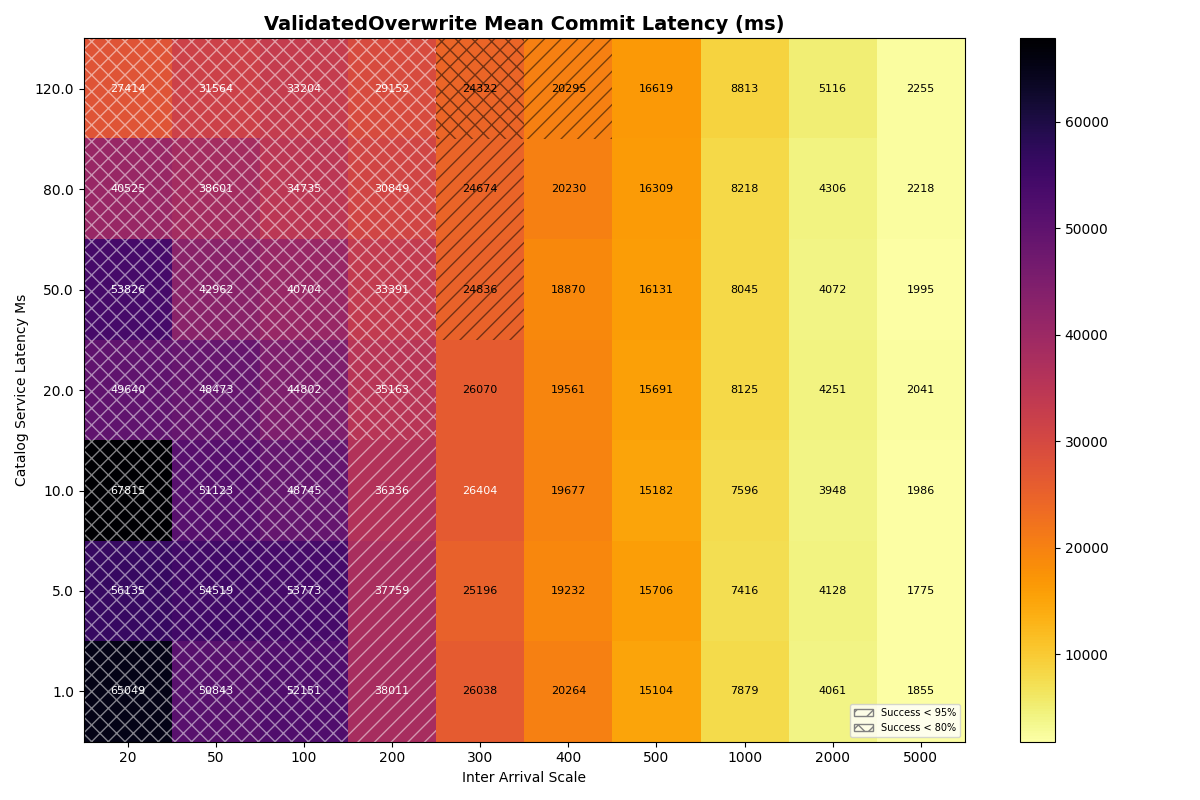
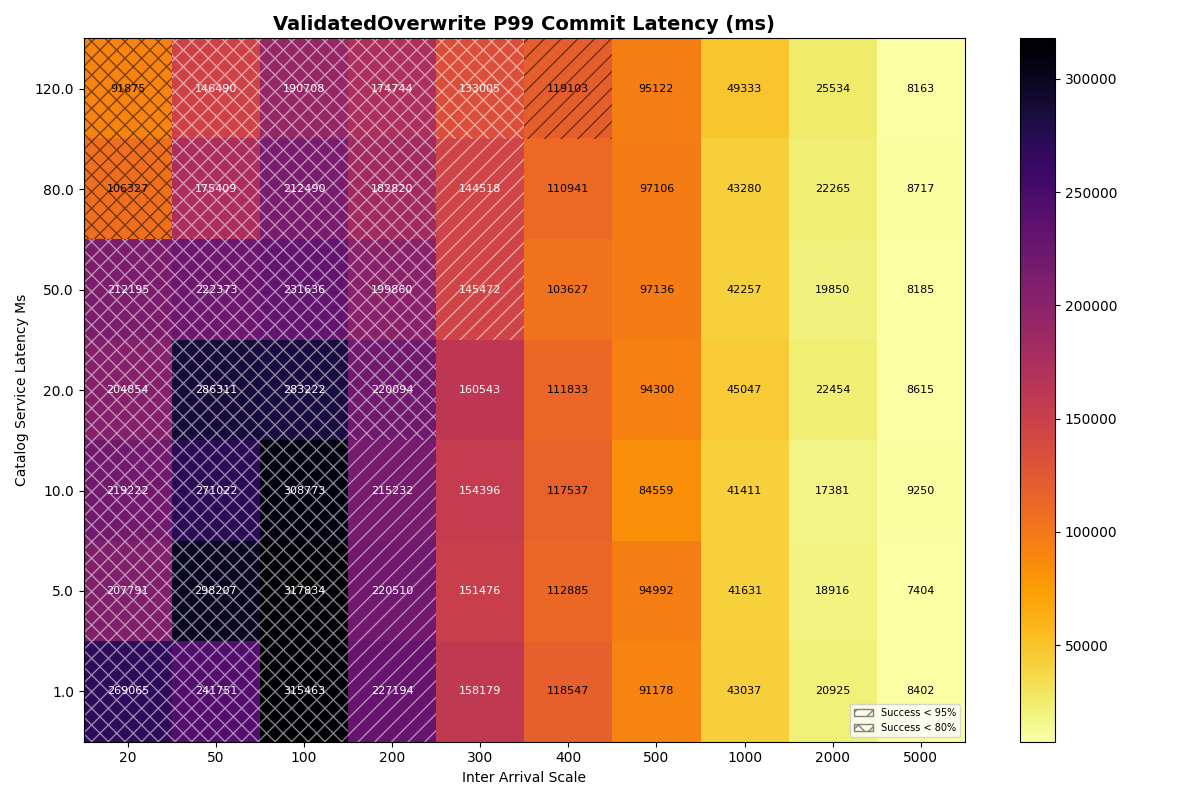
2b. 90/10 FA/VO workload, varied catalog latency
Next we add ValidatedOverwrite transactions back into the mix, with a 90/10 FA/VO workload.
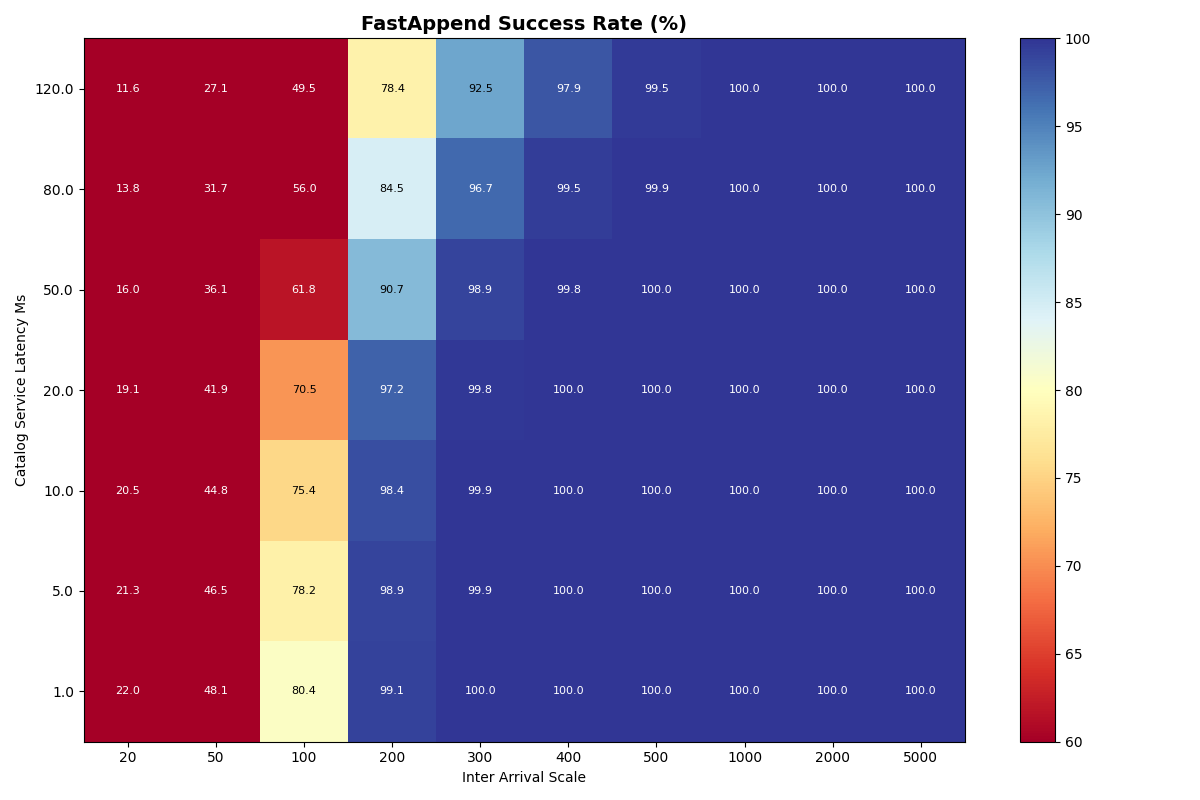
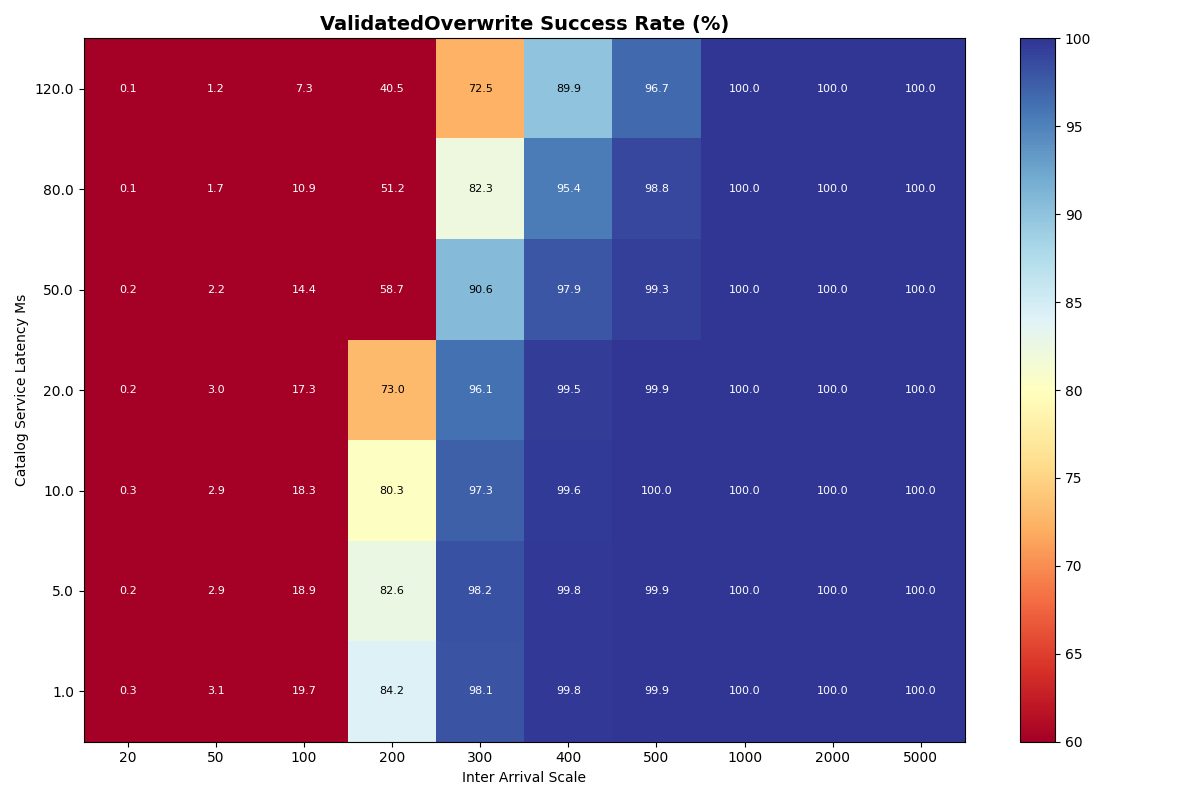
Unsurprisingly, FA transaction success rates are almost identical to 2a (FA-only) at all catalog latencies and inter-arrival times. At higher catalog latencies, VO success rates degrade more rapidly, between 1-2 commits/sec. At 120ms commit latency, success rates drop earlier and more sharply, starting at 1 commit/sec and plummeting thereafter.
Mean VO latencies are modestly higher as the catalog latency increases, but continue to be mostly determined by the arrival rate.
Takeaway: Catalog latency has a more pronounced, but minor effect on VO success rates in a mixed (90/10) workload below 80ms. At rates where VO transactions are viable (above 1s inter-arrival time), catalog latency has a minor impact on commit latency.
Conclusions
Single-table commit throughput is limited by the cost of preparing retries, not by the catalog. With an unrealistically fast (1ms) catalog, FastAppend-only workloads top out at 2-3 commits/sec; adding even 10% ValidatedOverwrite transactions drops the sustainable rate to around 2 commits/sec. Below these rates, catalog CAS latency adds modest per-commit overhead but does not change the success rate. Above them, no catalog- however fast- can help.
The most interesting finding is that ValidatedOverwrite transactions form IO convoys under load. Because each retry must read manifest lists proportional to the number of snapshots committed since the read snapshot, the work to prepare a retry grows with contention. Retries effectively serialize VO commit attempts, with p99 latencies reaching minutes even at moderate arrival rates. This is not a catalog bottleneck or an object store bottleneck- it is the cost of the table format’s own metadata protocol.
These are optimistic results. All conflicts are trivial (no real data to re-read), retries are immediate (no backoff), and the catalog is implausibly fast. Real workloads include compactions, GDPR deletions, and non-trivial overwrites that would only widen the gap. The protocol- as specified- limits single-table commit rates to low single digits per second.
In the next post, we use the CAS latency distributions measured across S3, S3 Express, Azure, and GCS to model multi-table catalogs stored in object storage. Distributing transactions across tables moves the bottleneck from per-table metadata I/O to catalog contention- a bottleneck that conditional operations can address.
Correction 2026-06-09
The numbers in this post were regenerated on 2026-04-17 after finding some simulator bugs, listed below. The bugs mostly cancel each other out leaving the qualitative conclusions unchanged, but the values are slightly more pessimisitic than in the original post. I intended to publish the updated numbers with the next entry in this series, but it was taking too long.
- Per-attempt I/O cost corrected. Each commit attempt now issues five S3 round-trips (
TM_read + ML_read + ML_write + TM_write + CAS) instead of three (MF_write + ML_read + ML_write). The old model both double-counted a manifest-file write the protocol doesn’t require and skipped the table-metadata read/write pair entirely. Net effect: the per-table ceiling drops from ~7.7 c/s to 5.7 c/s at S3 medians. - Timing leaks removed. The CAS version check and
catalog.read()now both split-yield at half-RTT. Previously, the simulator allowed the client to read the catalog state without waiting for the message delay. - VO convoy double-count removed. The IO convoy was charging the per-attempt manifest-list read twice and counting one extra historical manifest list per attempt. With both fixed, single-table VO P99 drops ~7% (203s vs 219s).
table_metadata_inlinedflag corrected. A config-drift bug let intermediate re-runs silently use inlined metadata (future work). This post now uses non-inlined metadata, matching the original intent.- I/O requests are serial. The intended “up to 4 I/O operations running in parallel” was inaccurate; the implementation ignored this parameter and issued I/O requests serially.
Overall: throughput is slightly lower, P50/P99 latencies are slightly higher. No curve changes shape and no comparison reverses.
| Metric | Previously | Corrected |
|---|---|---|
| FA single-table throughput ceiling | ~7.7 c/s (19% success @ 7.8 c/s) | 5.7 c/s (14% success) |
| FA practical ceiling (99%+ success) | ~2.7 c/s | 2.0 c/s |
| FA P50 at low load | 320 ms | 410 ms |
| FA P99 at saturation | 1.89 s | 2.58 s |
| VO P99 at IA=200 ms (pure VO) | 219 s | 203 s (convoy fixes) |
| FA success @ 50 ms IA | 42% | 33% |
“3–4 commits/sec” in the original post has been updated to “2–3 commits/sec”. The per-attempt cost changed from “~300 ms retry” to “five S3 round-trips per attempt, ~175 ms at S3 median latencies”.
Also some string property maps and namespaces, but it’s barely pushing kilobytes. ↩
The state of the repository reflects what it is: an active hobby workshop. Scraps of notes, half-baked code, and uncurated history. If it makes assumptions that need correction, I want them to be easy to find. It’s not intended as a polished, “release” of anything; it’s a sandbox, but it’s generating results that make sense to me. Running these simulations takes hours, so email me if you want the data from a full run (~6GB) of these experiments and I’ll upload them. ↩