Simulating Multi-Table Contention in Catalog Formats
Published:
tl;dr
Update: Corrected simulations 2026-06-09
Table formats like Apache Iceberg were designed before conditional operations were widely available in object stores. These operations are sufficient to support Iceberg’s linearizable table update protocol, but how would they perform? Simulating multi-table commit contention at the catalog suggests:
Partitions help throughput and VO tail latency. Distributing a uniform workload across 20 tables roughly doubles aggregate throughput for slower providers (1.5–2.5x) and compresses VO mean latency by 5–8x. With zipfian skew, the most popular table converges to single-table performance, but other tables are mostly unaffected by the hot table’s contention.
Provider choice is a larger lever than table count. S3 Express One Zone (S3x) sustains 14.6 c/s on a single table- more per-table throughput than spreading a workload across 50 tables on S3 Standard, even with an “instant” catalog. The entire commit pipeline (CAS + manifest I/O) compresses with faster storage; adding tables only helps with catalog contention.
Longer-tailed distributions compound under contention. Each attempt requires multiple reads/writes in the object store. Variability extends the hazard window and makes workloads less stable overall. For example, S3 and Azure Premium have similar median CAS latency (61, 64ms), but Azure Standard’s longer tails result in more failures as it approaches saturation.
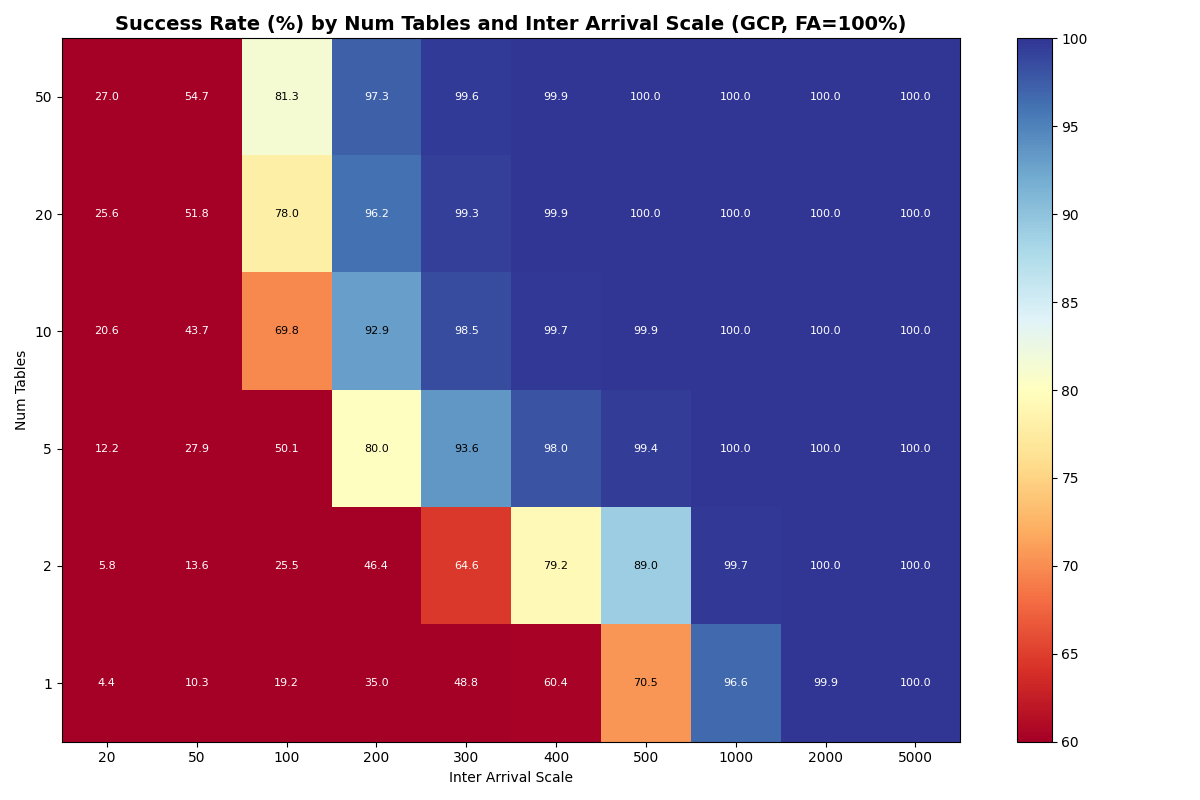
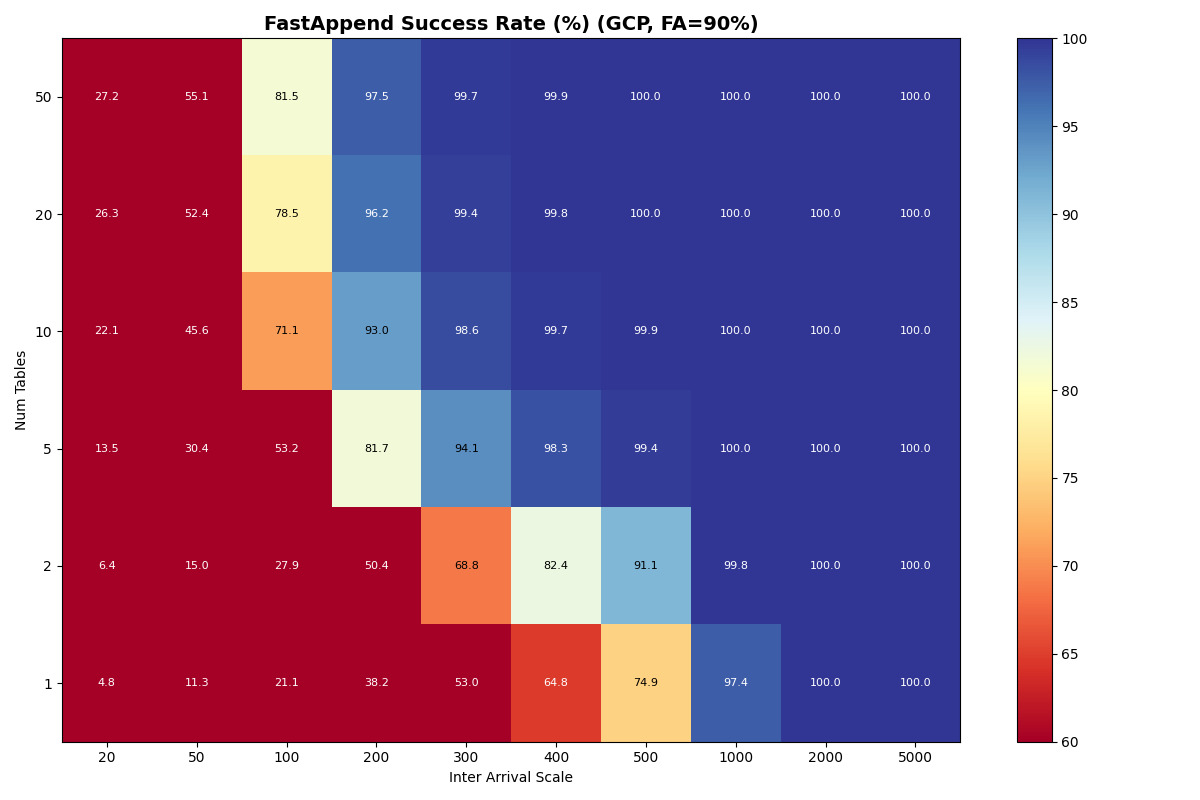
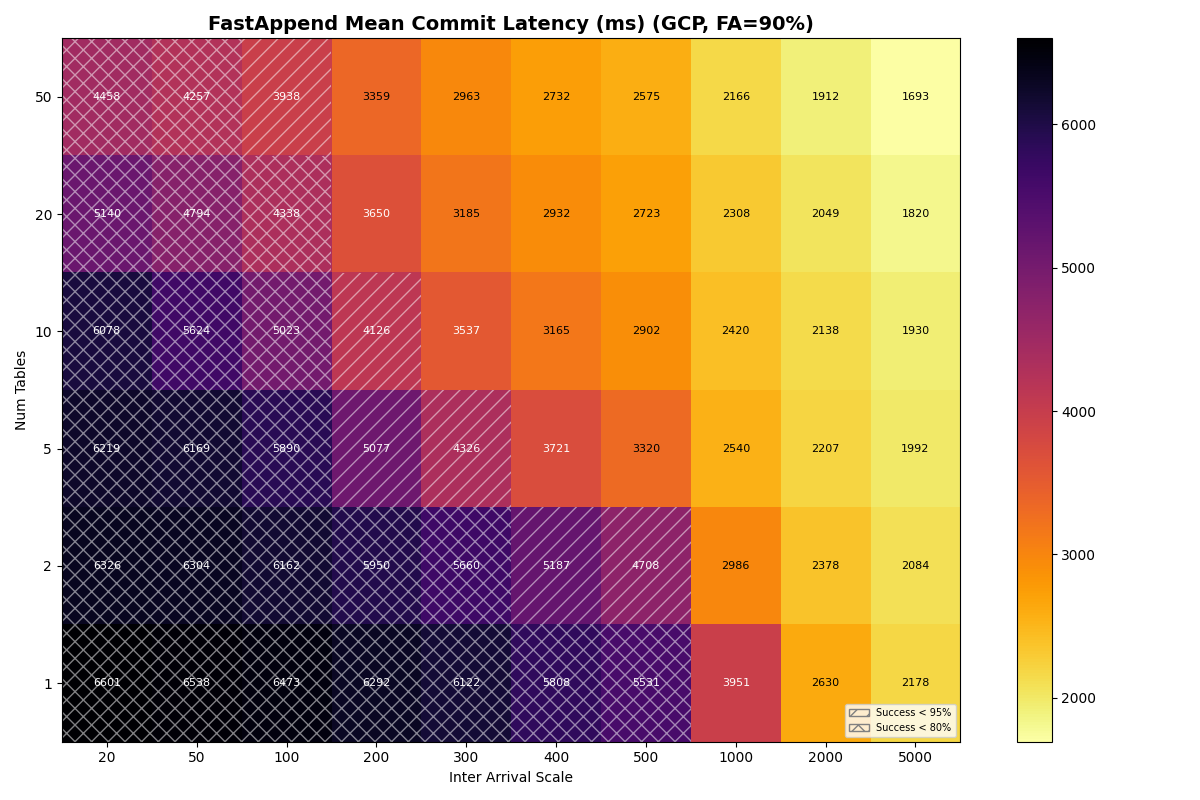
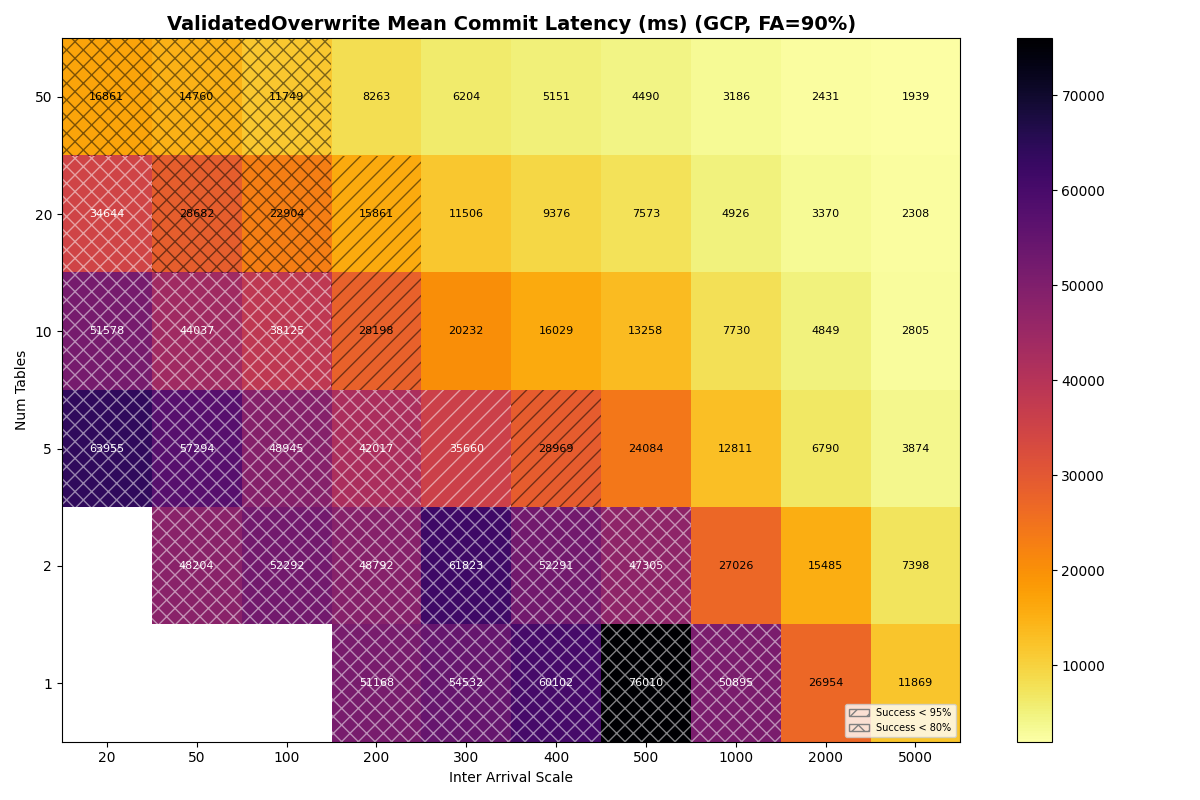
GCS is not viable for catalog-as-file workloads. This follows from raw GCS CAS latency. Commit success degrades above ~0.4 commits/sec, whether the workload is pure FastAppend or a 90/10 mix. Adding tables barely helps: the per-table I/O cost is high enough that 50 tables only lifts the usable rate to ~0.7 c/s.
The commit protocol bottleneck is well-known among table format developers; lifting it whole or in part into a dedicated service is a popular solution. Now that we’ve measured and characterized the protocol, we can explore those tradeoffs in a later post.
Commit Contention in Catalog Files
Previously we simulated single-table commit rates. Now we add another dimension: multiple tables in the catalog. These are not multi-table transactions, but rather independent table updates that physically conflict at the catalog. For example, if transactions T1 and T2 update tables A and B respectively, T1 successfully updating the catalog reference for A could cause T2 to fail its commit to B. However, repairing T2’s commit is cheaper than what we measured last time: T2 only needs to retry at the catalog, not rewrite the table metadata or its manifest list.
This models the “catalog as file” case where the entire catalog is conditionally replaced on every commit. Note that as the number of tables increases, the inter-arrival time is distributed across all the tables in the catalog; be careful not to read it as the arrival rate for a single table, which we measured before.
Experiment Summary
The workload mix is the same as in the single-table experiments, composed of “light” FastAppend (FA) and “heavy” validated overwrite (VO) transactions. The salient difference between FA and VO is the I/O necessary to retry a transaction: a FA transaction needs to re-read only the latest manifest list while a VO transaction needs to read the manifest lists of all new snapshots of that table.
The workload is steady, but optimistic: it assumes no transaction needs to read beyond the manifest list to investigate or repair a conflict before retrying. Real workloads include commit attempts that do more work between attempts, increasing the chance of conflict.
Tables are selected from either uniform or Zipfian distributions, as annotated.
| Exp | Description | Fixed | Swept | Configs |
|---|---|---|---|---|
| 4a | Multi-table contention (FA) | 1 group, FA=100%, S3, conflicts=0% | num_tablescatalog_latency_msinter_arrival_scale | 240 |
| 4b | Multi-table contention (mix) | 1 group, FA=90%/VO=10%, S3, conflicts=0% | num_tablescatalog_latency_msinter_arrival_scale | 240 |
| 4c | Multi-table, real providers | 1 group, conflicts=0%, backend=storage | providernum_tablesfast_append_ratiointer_arrival_scale | 900 |
| Parameter | Values | Description |
|---|---|---|
inter_arrival_scale | [20, 50, 100, 200, 300, 400, 500, 1000, 2000, 5000] ms | Scale parameter for the exponential distribution of transaction inter-arrival times. Lower values correspond to higher transaction rates. |
fast_append_ratio | [1.0, 0.9, 0.8, 0.7, 0.5, 0.3, 0.1, 0.0] | Ratio of FastAppend (light) transactions to ValidatedOverwrite (heavy) transactions in the workload mix. 1.0 means all transactions are FastAppend, while 0.0 means all transactions are ValidatedOverwrite. |
catalog_latency_ms | [ 1, 10, 50, 120] | Latency of the catalog’s compare-and-set (CAS) operation in milliseconds. This models the time it takes for a transaction to attempt a commit and receive a response from the catalog. |
num_tables | [1, 2, 5, 10, 20, 50] | Number of tables in the catalog. This models the contention at the catalog when multiple tables are being updated concurrently. |
provider | [s3x, s3, azurex, azure, gcp] | Cloud storage provider used for the catalog. Each provider has different CAS latency distributions, which affect the commit success rates and latencies. |
In all experiments, the manifest list and table metadata sizes are fixed (10KiB and 100KiB, respectively). Manifest and metadata I/O uses unconditional GET and PUT operations, not the conditional operations measured earlier. We use the same S3 Standard latencies for experiments 4a/4b as we used in the single-table experiments. We use provider distributions for experiment 4c (i.e., unconditional reads/writes for metadata, conditional writes for the catalog).
Latency distributions for S3 Standard (click to expand)
Distribution Parameters
GET (unconditional read)
Modeled as Lognormal(mu=ln(median), sigma), floored at min_latency_ms.
| Operation | median (ms) | sigma | min_latency (ms) |
|---|---|---|---|
| GET | 27 | 0.62 | 10 |
GET operations don’t include sizes because latency is dominated by fixed overheads at these sizes.
PUT (unconditional write)
Modeled as Lognormal(mu=ln(base + rate * size_MiB), sigma), floored at min_latency_ms.
| Operation | base (ms) | rate (ms/MiB) | sigma | min_latency (ms) |
|---|---|---|---|---|
| PUT | 60 | 20 | 0.29 | 10 |
Percentiles
| Operation | p5 | p10 | p25 | p50 | p75 | p90 | p95 | p99 |
|---|---|---|---|---|---|---|---|---|
| GET | 10 | 12 | 18 | 27 | 41 | 60 | 75 | 114 |
| PUT | 37 | 42 | 50 | 60 | 73 | 87 | 97 | 118 |
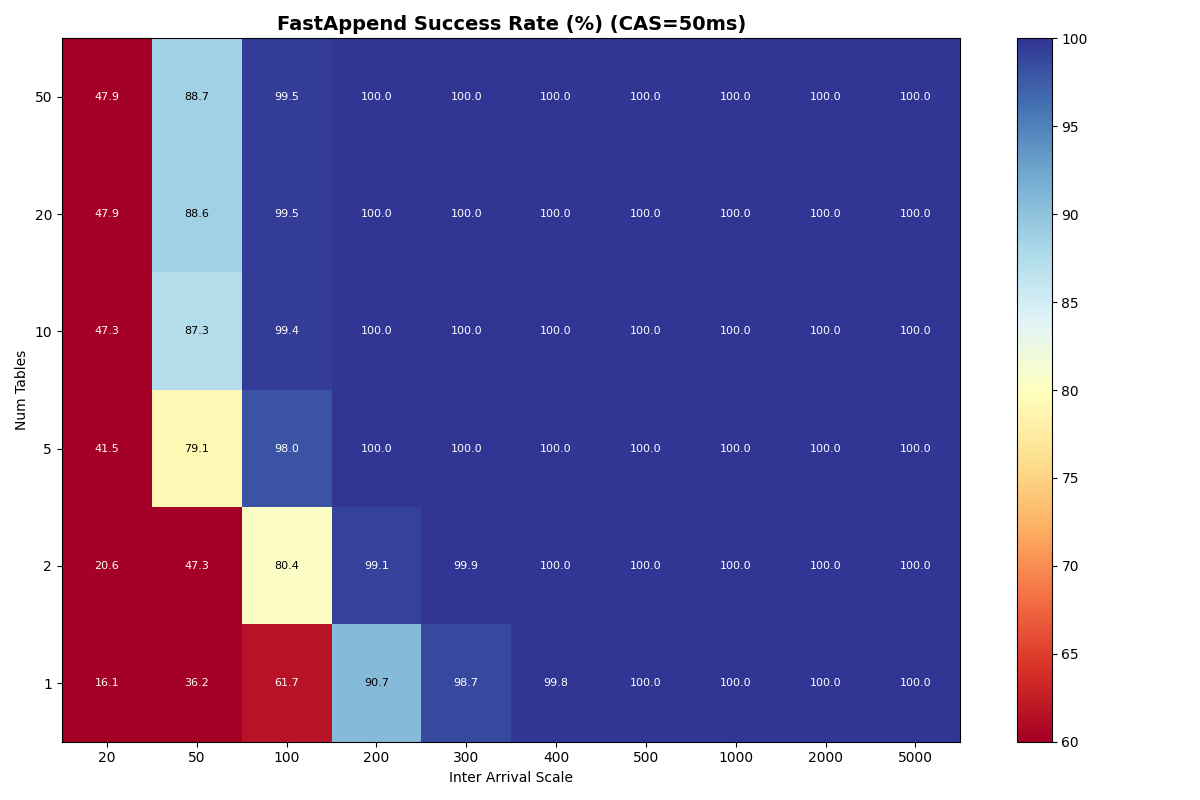
Multi-table scaling (4a, 4b)
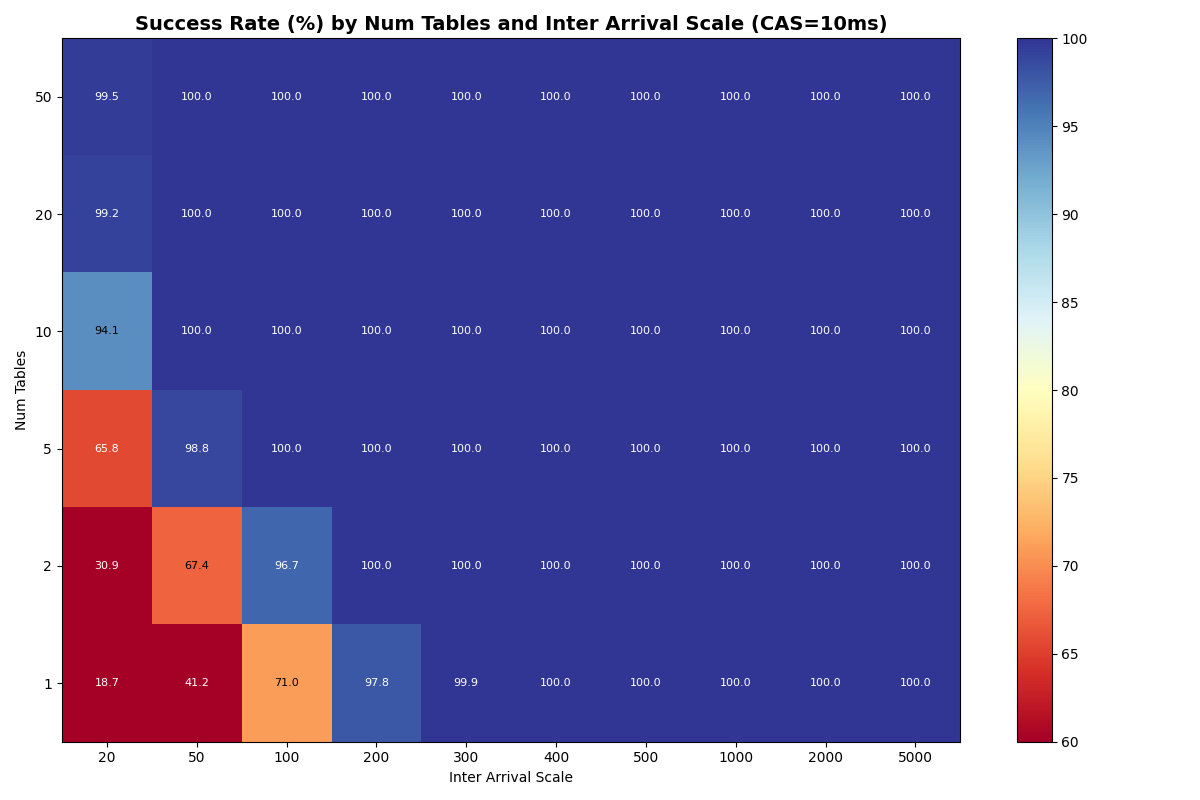
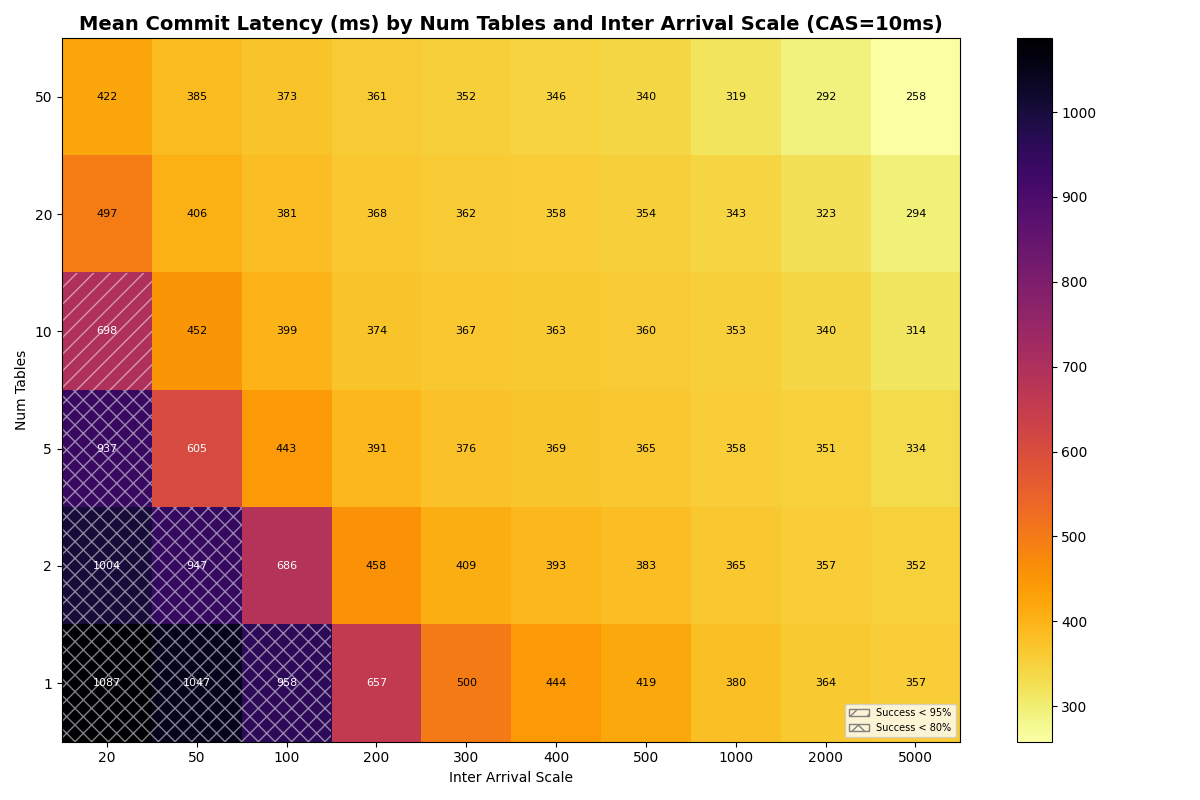
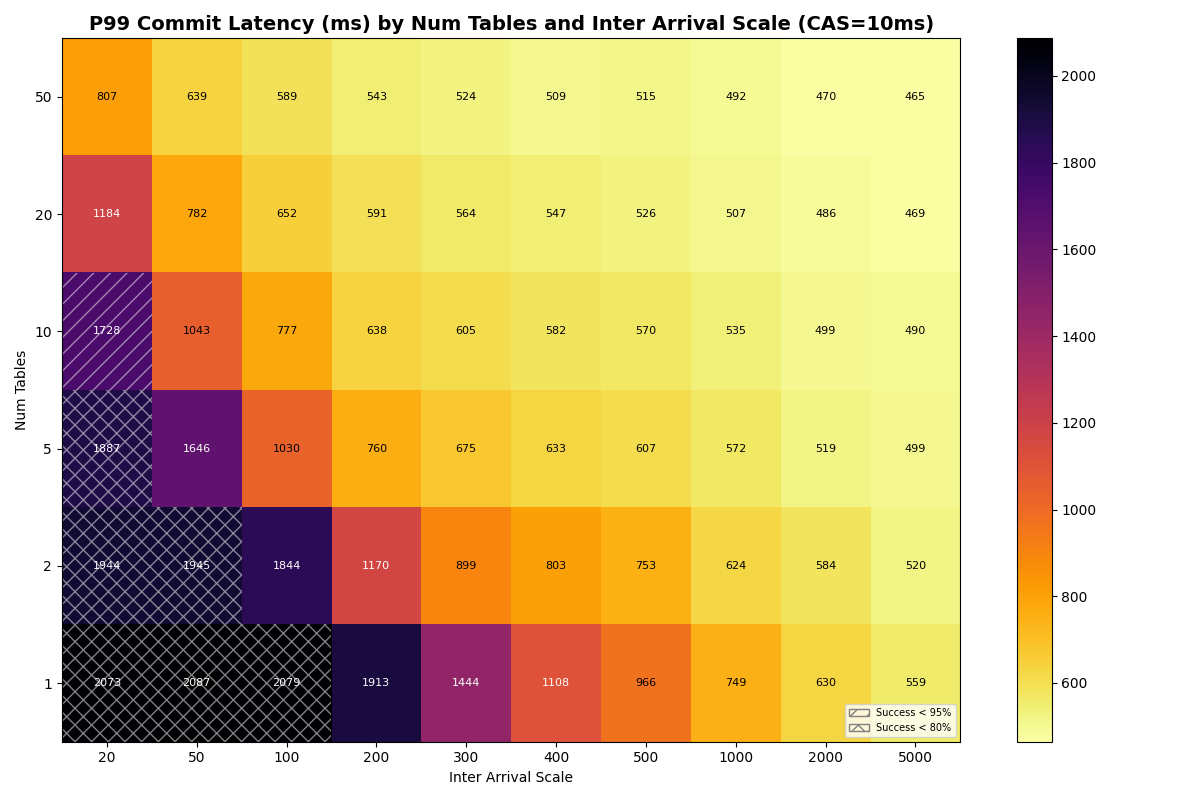
Before measuring real providers, we sweep the number of tables (1-50) and catalog CAS latency (1-120ms) to establish how much multi-table scaling can buy. Experiments 4a (FA-only) and 4b (90/10 FA/VO) use simulated S3 Standard latencies for manifest I/O, with synthetic CAS latencies. Full heatmaps are in Appendix A.
Uniform distribution: tables move the bottleneck to the catalog
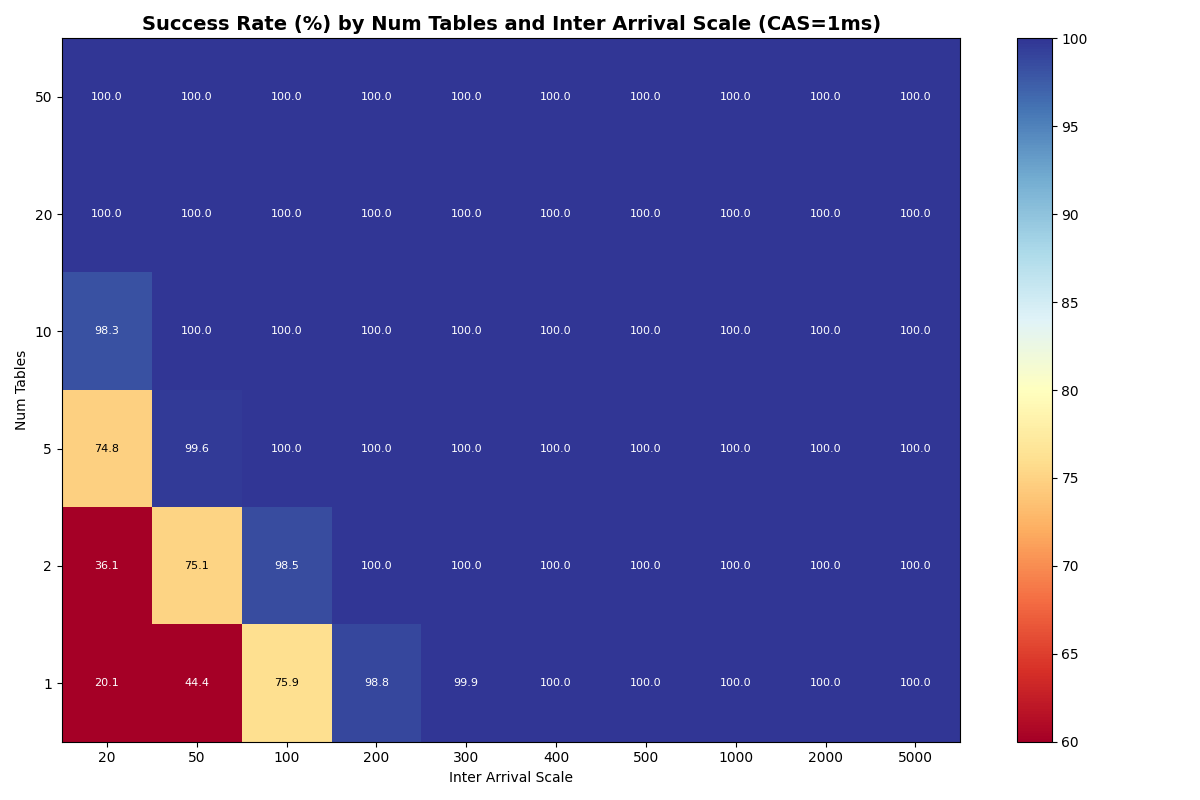
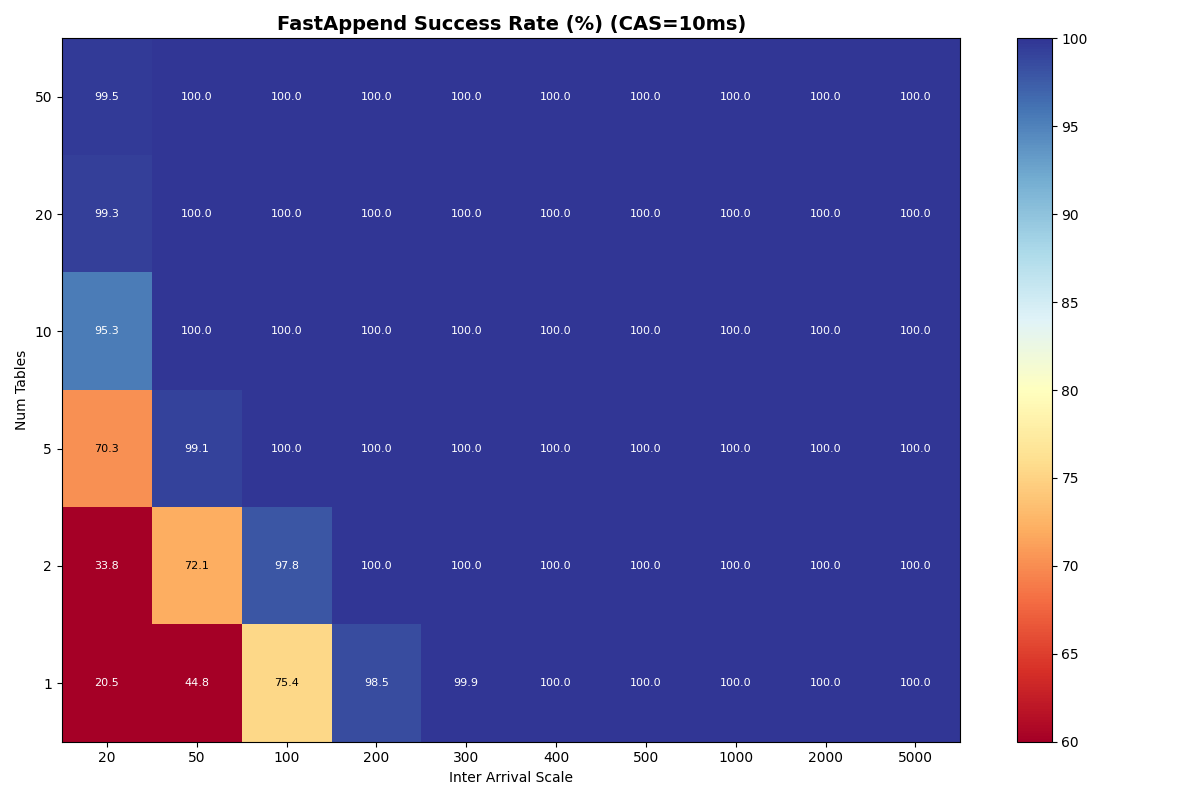
With a fast catalog (1-10ms CAS), distributing FA transactions uniformly across more tables lifts success rates at high load, though the 20ms×50-tables corner is no longer a free lunch: 50 tables at 20ms inter-arrival reach 88% success at 1ms CAS, 70% at 10ms CAS. At 100ms+ inter-arrival (≤10 c/s offered), 10+ tables hit 100% success at CAS latencies up to 10ms.
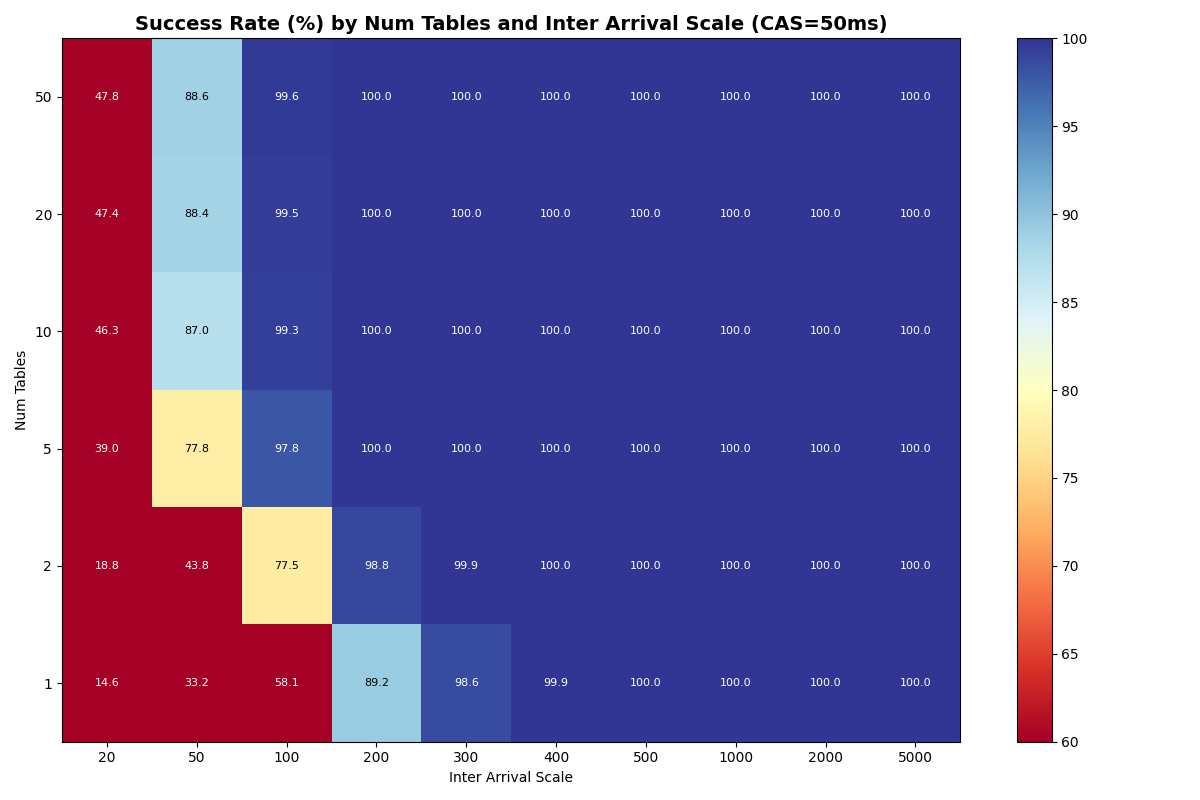
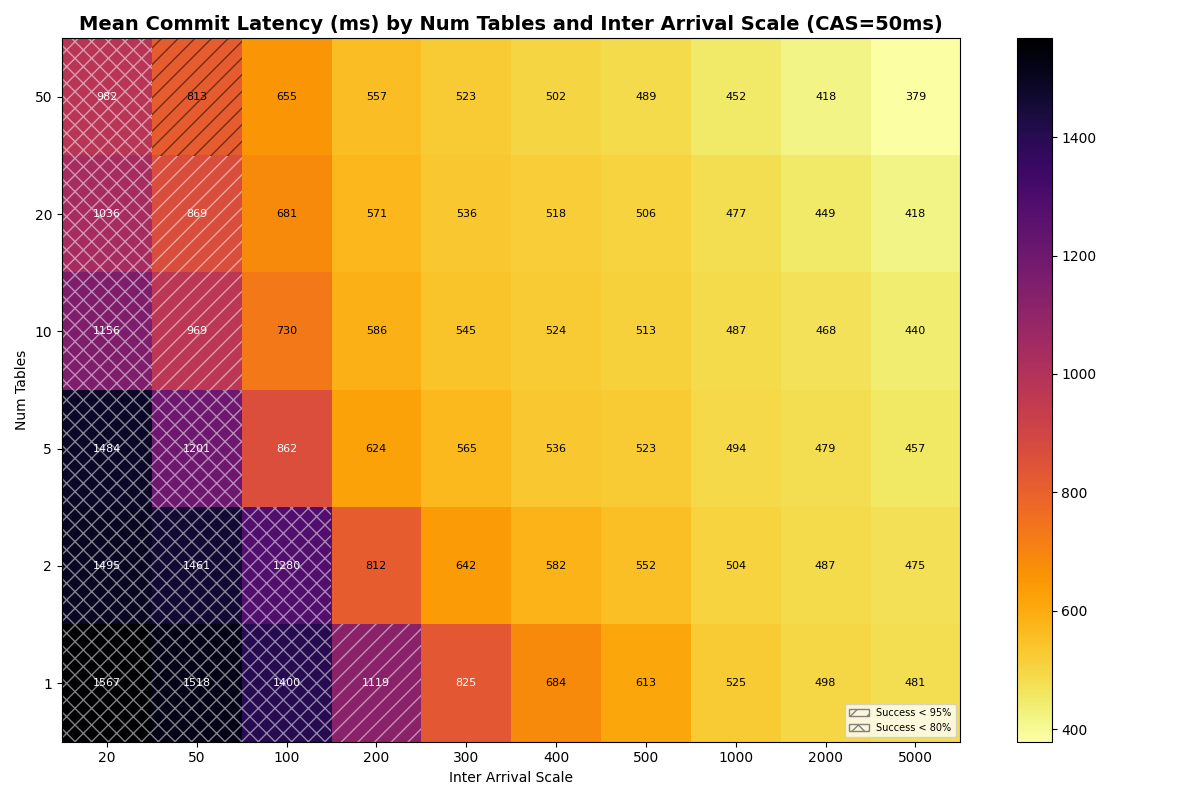
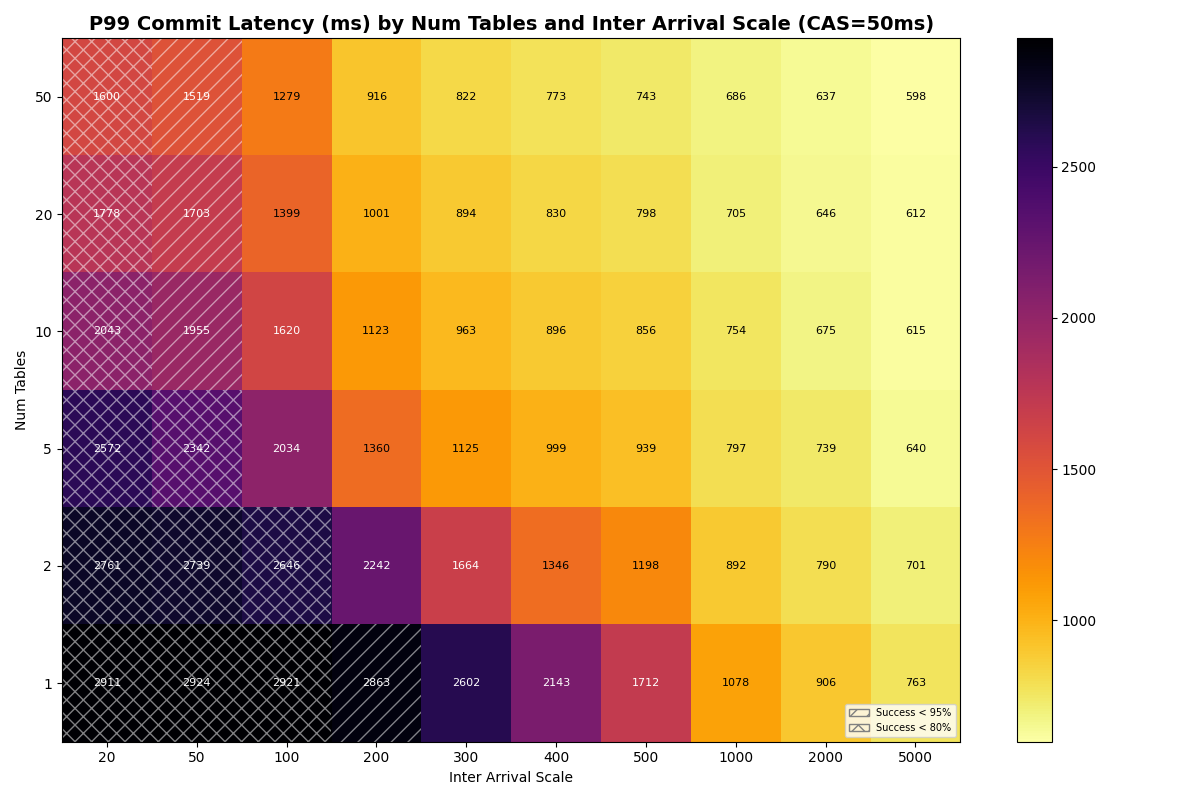
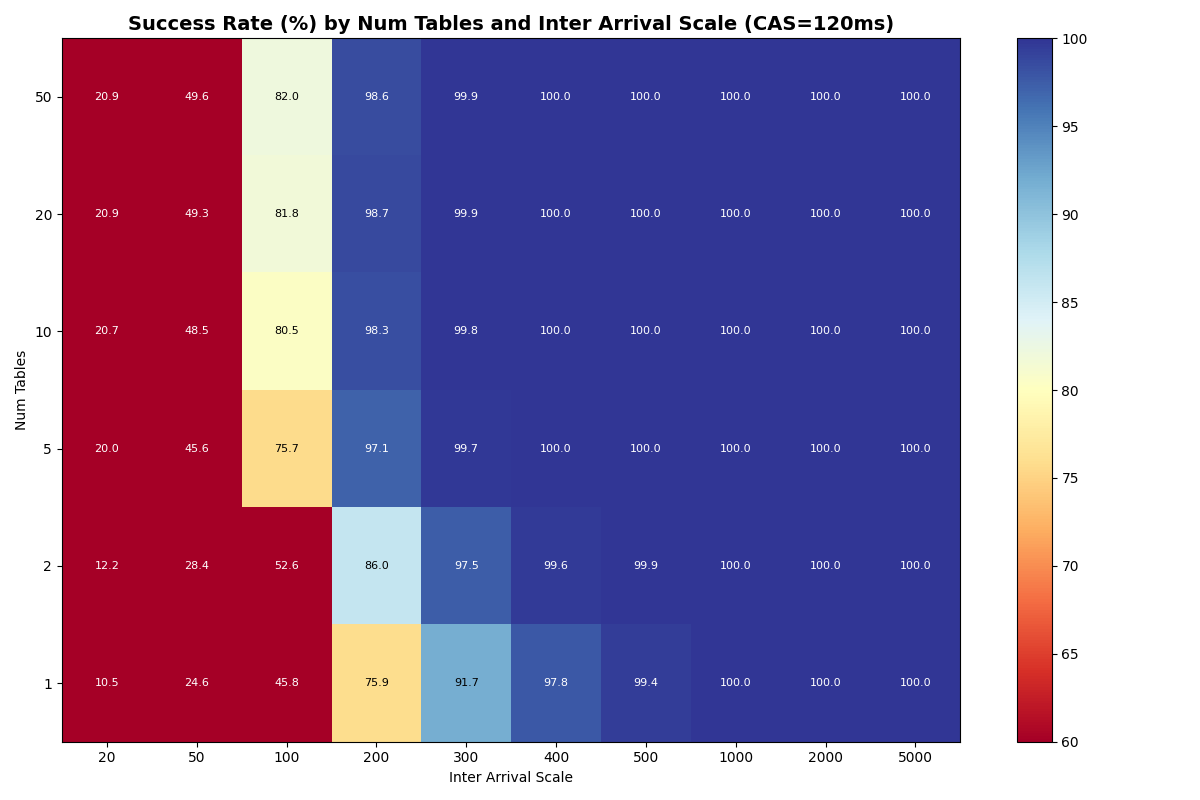
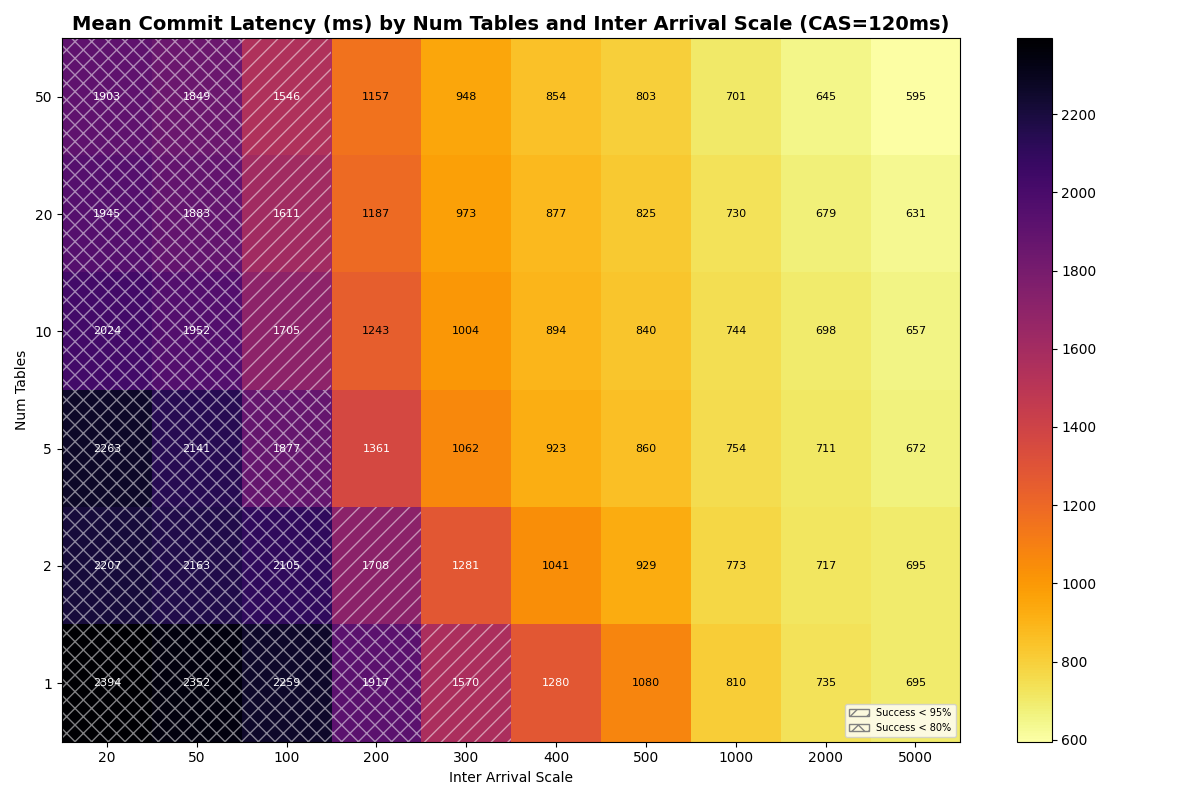
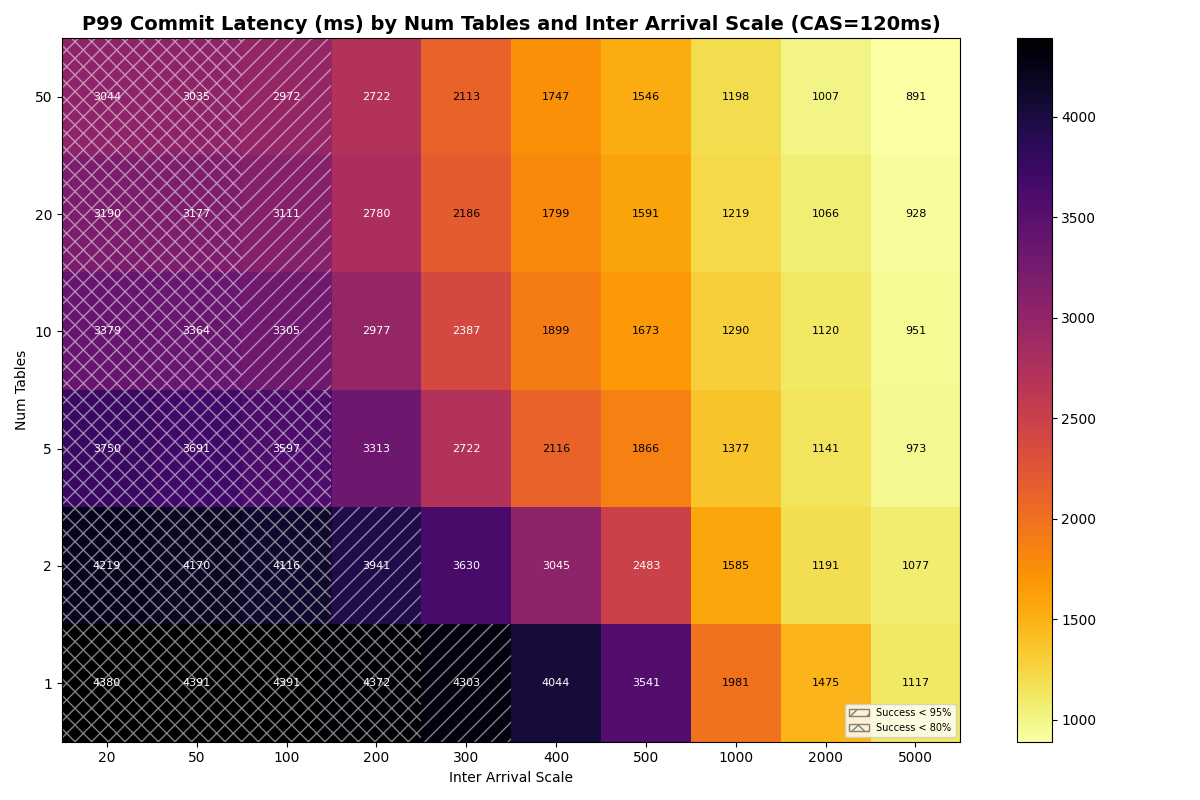
At CAS latencies closer to real providers (50-120ms), the frontier tightens. At 50ms CAS, the knee (>95% success rate) sits near ~10 c/s with 20+ tables. At 120ms CAS, the knee drops to ~5 c/s- the catalog round-trip dominates retry cost at every table count.
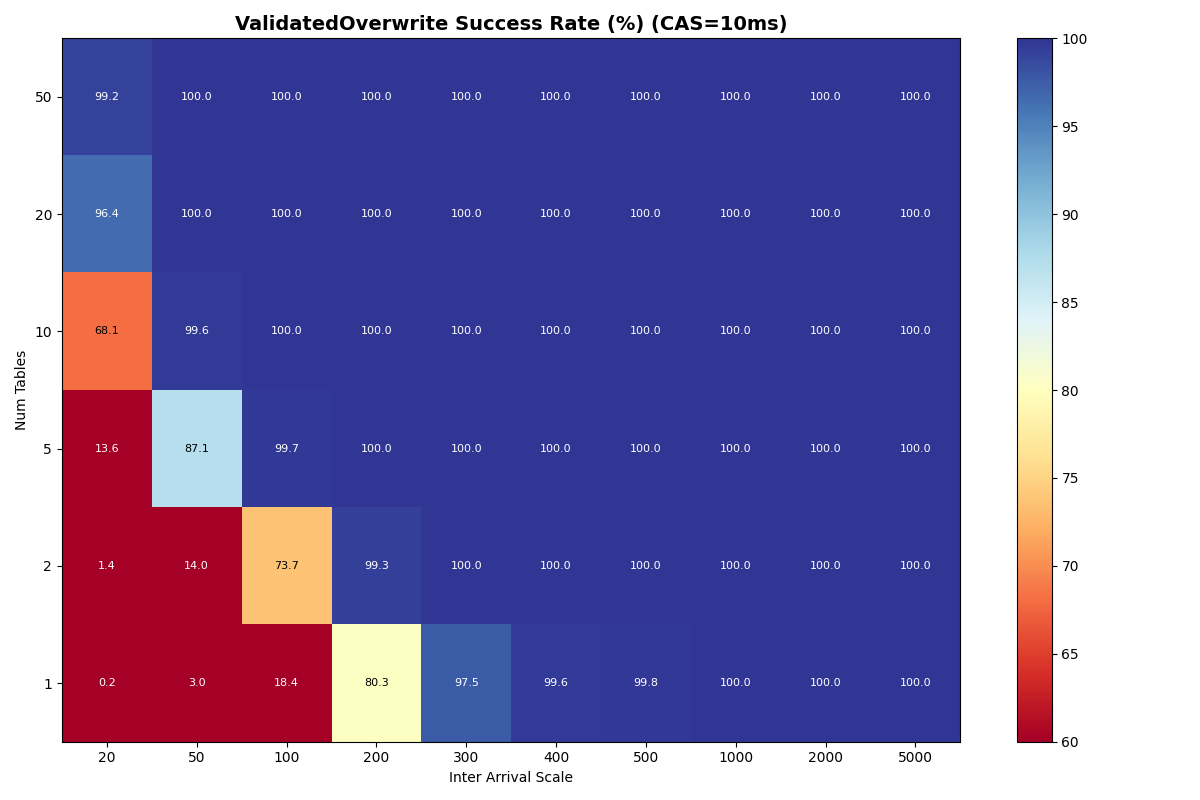
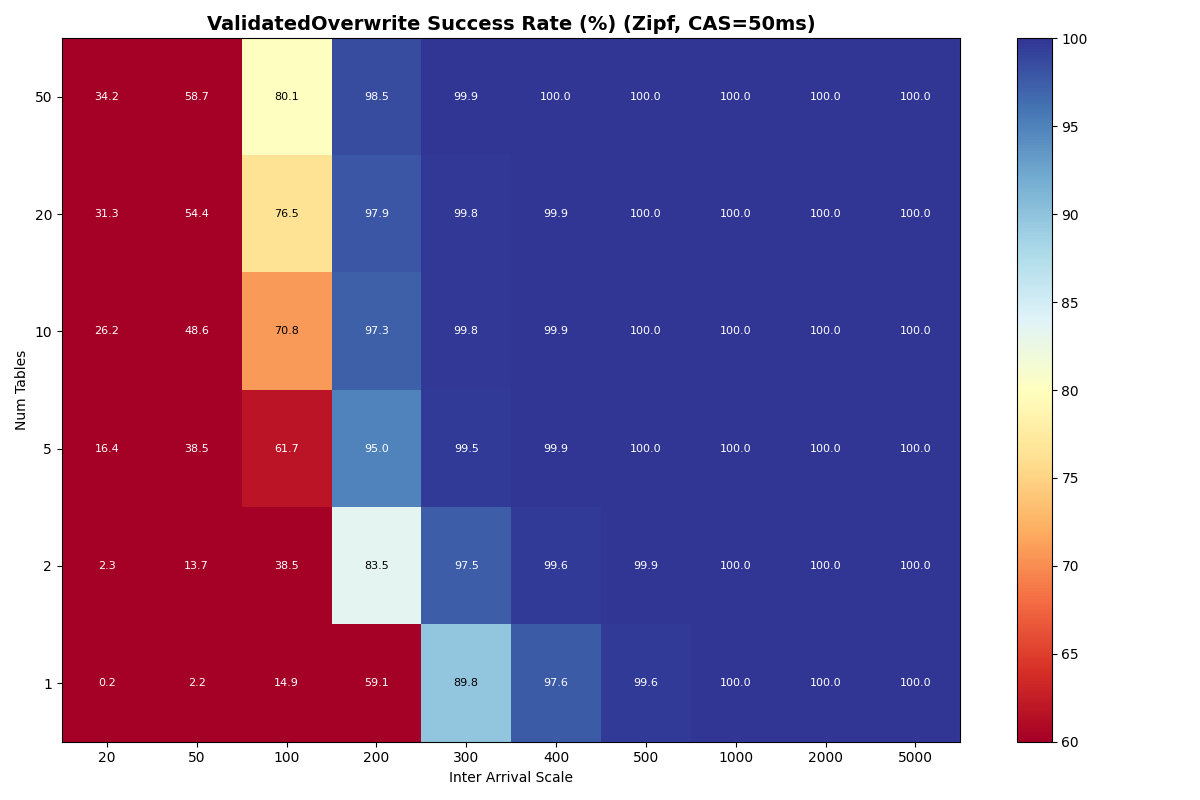
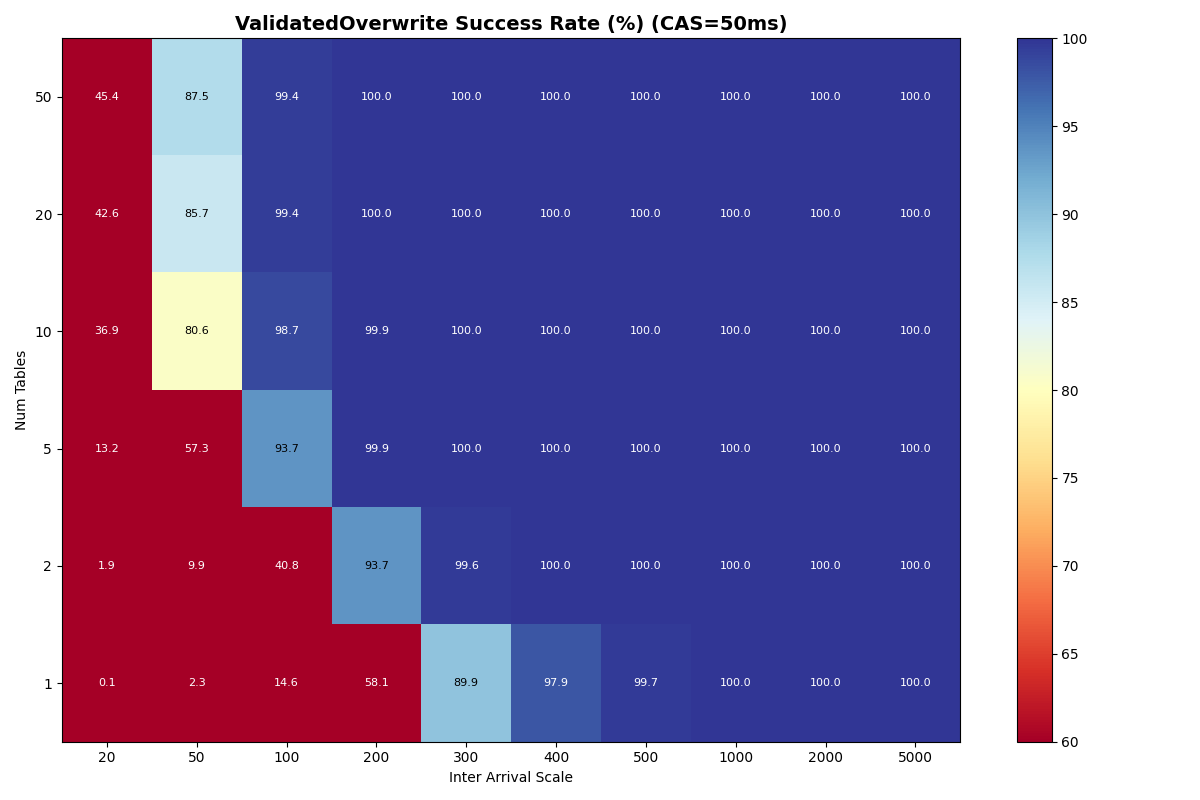
Adding VO: table partitioning reduces per-table retry cost
Adding 10% VO transactions barely changes FA success rates. VO success improves dramatically with table count. Each VO retry reads a manifest list for each snapshot committed to that table since the read snapshot; with more tables, each table sees fewer commits, reducing the per-table retry cost. At 10ms CAS with 50 tables, VO approaches FA success rates above 100ms inter-arrival; at 50ms CAS, VO and FA success rates converge above 10 tables for moderate loads. At 120ms CAS, the catalog limits both FA and VO equally.
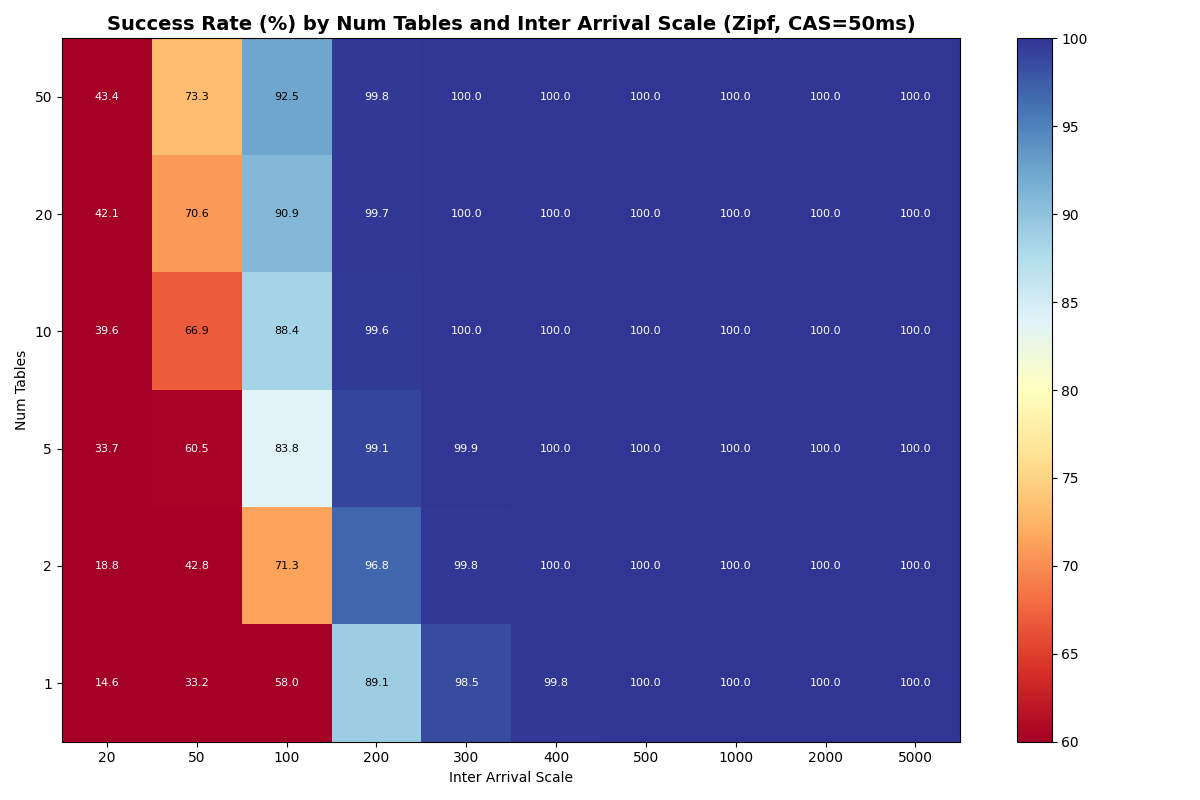
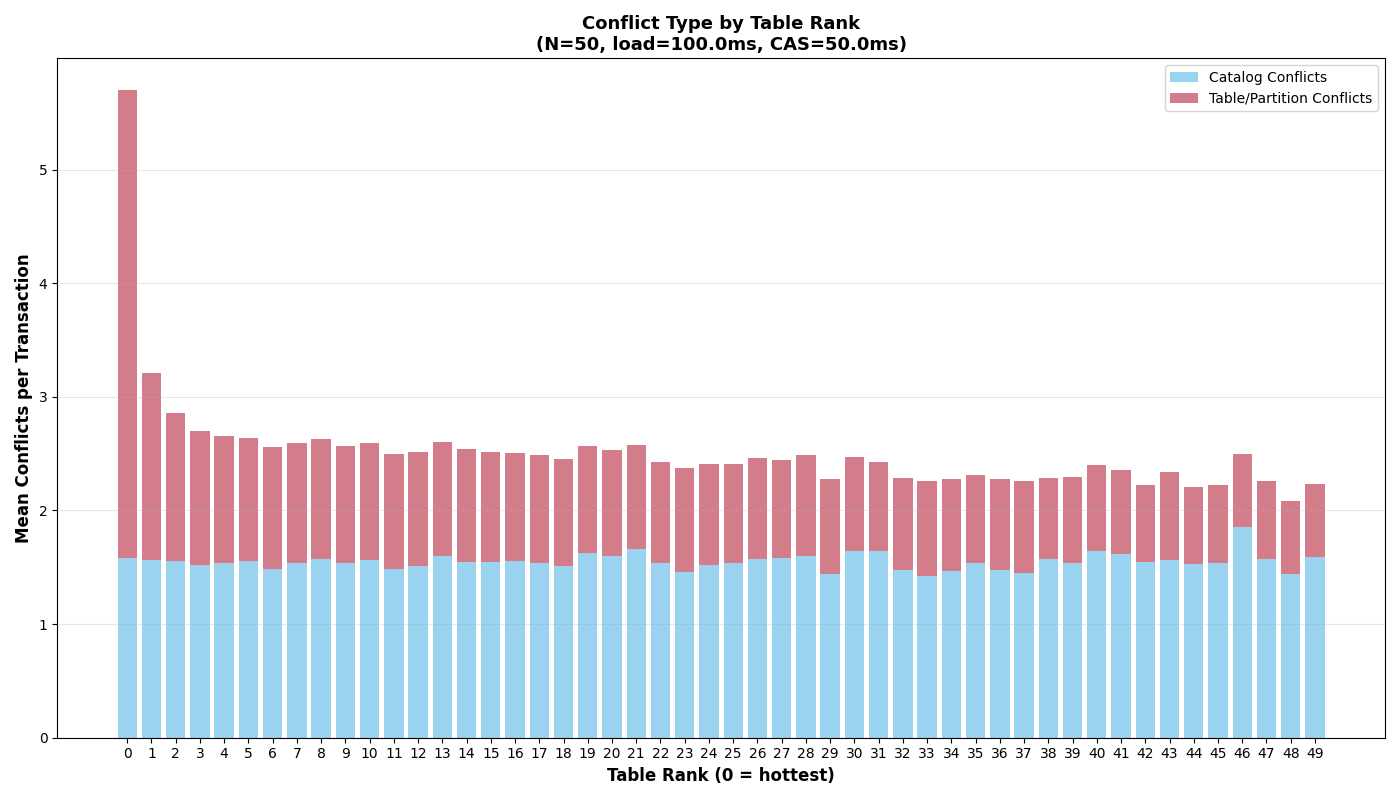
Zipfian Skew: the most popular table converges to single-table performance
Under a Zipfian (α = 1.5) distribution, the probability of selecting the kth-ranked table is proportional to 1/k1.5. The rank-1 table absorbs ~50% of writes regardless of how many tables exist; rank-2 gets ~18%, rank-3 ~10%, and the distribution falls off steeply. The effective table count tops out at ~4.5 even with 50 physical tables.
The rank-1 table behaves approximately like a single table at half the global arrival rate, with a small penalty from catalog conflicts. At low load, rank-1 success rates and latencies converge to the single-table baseline; at high load, catalog conflicts from other tables’ writes consume part of the retry budget, degrading success rates below the single-table equivalent.
Under Zipf, 70% of retries are same-table conflicts (requiring manifest I/O), compared to ~2% under uniform distribution with 50 tables. Adding physical tables beyond 10 barely helps- Zipf with 50 tables performs like uniform with ~5 tables.1 This is unsurprising, given that additional tables shift diminishing fractions of the workload.
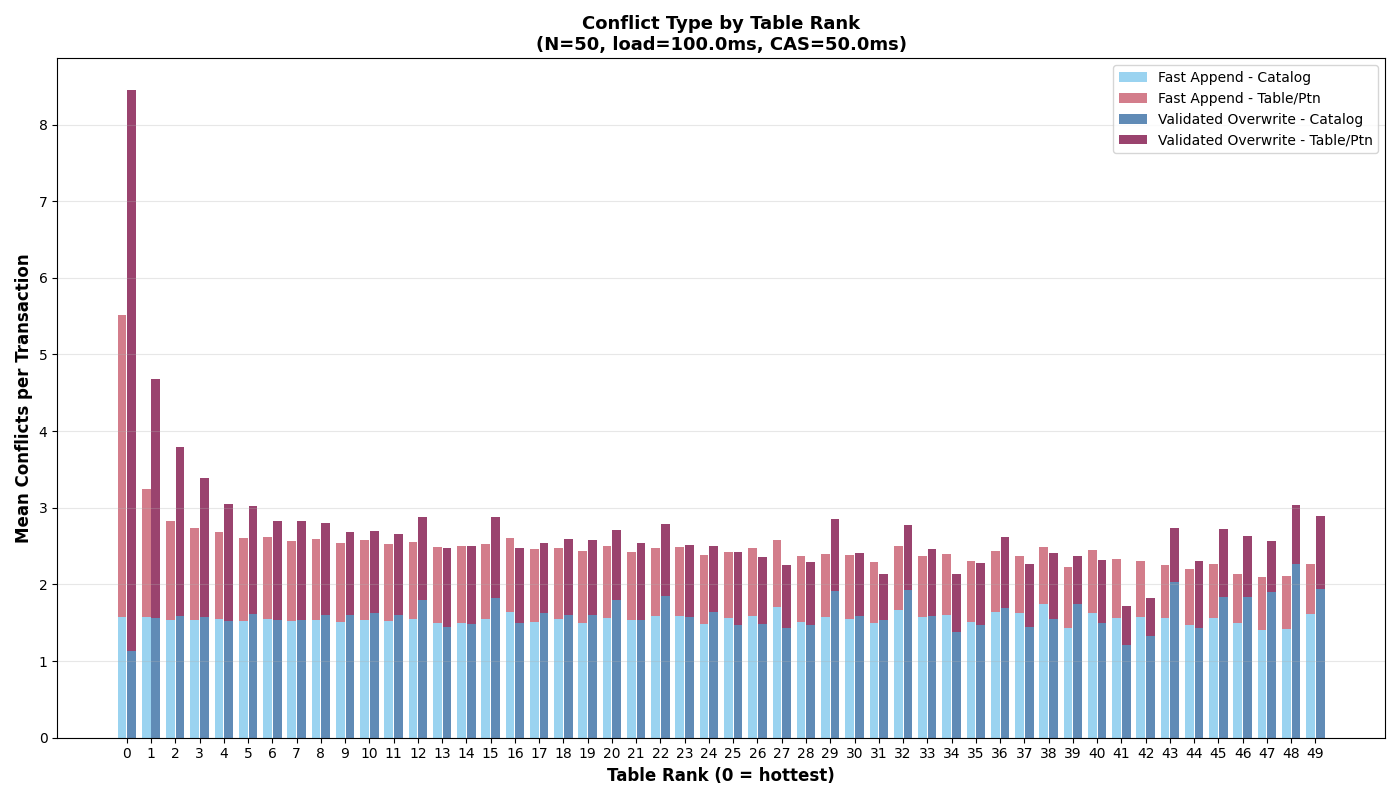
Adding back VO transactions to the zipfian distribution, we see a similar effect: the most popular table converges to single-table performance, VO transactions are more sensitive (particularly at high load) to catalog conflicts, and sustainable single-table throughput with VO transactions is much lower. Catalog conflicts are evenly distributed across tables, but the most popular table also accumulates per-table conflicts where VO transactions struggle to complete at high load.
Takeaway: Uniform distribution shows partitioning is effective, until the CAS latency becomes the bottleneck. When the distribution is skewed (zipfian), retries from popular tables have minimal impact on other tables. These results also suggest that catalog and table conflicts should be handled separately by the retry policy. While these simulations assume a steady arrival rate following a distribution, many real workloads burst in a particular table. Exponential backoff for table conflicts and immediate retry for catalog conflicts would be more effective for that workload.
4c. Multiple tables, varied workload ratio, measured CAS distributions
Real provider CAS latencies (22-170ms) fall well above the 1-10ms sweet spot from 4a/4b, so most workloads will operate in the regime where CAS latency limits throughput. Now we substitute the CAS latencies measured for each provider and published unconditional read/write latencies. The full results are in Appendix B.
We’re assigning labels to these distributions matching observations from each provider, but this is still a model of the commit protocol. We’re interested less in hitting the moving target of real provider performance and more in learning from the model: when does CAS latency become the bottleneck? (When) does storage variability (modeled as a lognormal distribution) impact commit success rates?
The synthetic parameter sweeps in 4a/4b varied CAS latency and workload to measure commit success rates/latency holding the provider (S3) constant. Now we want to see how different provider profiles interact with workload mixes and table counts.
Latency distributions for storage providers (click to expand)
Distribution Parameters
GET (unconditional read)
Modeled as Lognormal(mu=ln(median), sigma), floored at min_latency_ms.
| Provider | median (ms) | sigma | min_latency (ms) |
|---|---|---|---|
| S3 Express | 2.5 | 0.57 | 1 |
| S3 Standard | 27 | 0.62 | 10 |
| Azure Premium | 35 | 0.08 | 20 |
| Azure Standard | 38 | 0.66 | 20 |
| GCS | 200 | 0.30 | 80 |
PUT (unconditional write)
Modeled as Lognormal(mu=ln(base + rate * size_MiB), sigma), floored at min_latency_ms.
| Provider | base (ms) | rate (ms/MiB) | sigma | min_latency (ms) |
|---|---|---|---|---|
| S3 Express | 6.5 | 10 | 0.24 | 1 |
| S3 Standard | 60 | 20 | 0.29 | 10 |
| Azure Premium | 41 | 15 | 0.10 | 20 |
| Azure Standard | 45 | 25 | 0.50 | 20 |
| GCS | 200 | 17 | 0.30 | 80 |
GET Percentiles
| Provider | p5 | p10 | p25 | p50 | p75 | p90 | p95 | p99 |
|---|---|---|---|---|---|---|---|---|
| S3 Express | 1 | 1 | 2 | 2 | 4 | 5 | 6 | 9 |
| S3 Standard | 10 | 12 | 18 | 27 | 41 | 60 | 75 | 114 |
| Azure Premium | 31 | 32 | 33 | 35 | 37 | 39 | 40 | 42 |
| Azure Standard | 20 | 20 | 24 | 38 | 59 | 89 | 113 | 176 |
| GCS | 122 | 136 | 163 | 200 | 245 | 294 | 328 | 402 |
PUT Percentiles
| Provider | p5 | p10 | p25 | p50 | p75 | p90 | p95 | p99 |
|---|---|---|---|---|---|---|---|---|
| S3 Express | 4 | 5 | 6 | 7 | 8 | 9 | 10 | 12 |
| S3 Standard | 37 | 42 | 50 | 60 | 73 | 87 | 97 | 118 |
| Azure Premium | 35 | 36 | 39 | 41 | 44 | 47 | 49 | 52 |
| Azure Standard | 20 | 24 | 32 | 45 | 63 | 86 | 103 | 145 |
| GCS | 122 | 136 | 164 | 200 | 245 | 294 | 328 | 402 |
Provider summary
| Provider | CAS median (ms) | CAS σ | Read base (ms) | Read σ | Write base (ms) | Write σ | Min latency (ms) |
|---|---|---|---|---|---|---|---|
| S3 Express | 22 | 0.22 | 2.5 | 0.57 | 6.5 | 0.24 | 1 |
| S3 | 61 | 0.14 | 27 | 0.62 | 60 | 0.29 | 10 |
| Azure Premium | 64 | 0.73 | 35 | 0.08 | 41 | 0.10 | 20 |
| Azure | 93 | 0.82 | 38 | 0.66 | 45 | 0.50 | 20 |
| GCP | 170 | 0.91 | 200 | 0.30 | 200 | 0.30 | 80 |
Single-table Provider Performance
| Provider | 100/0 (c/s) | 100/0 (FA/VO lat) | 90/10 (c/s) | 90/10 (FA/VO lat) | 50/50 (c/s) | 50/50 (FA/VO lat) |
|---|---|---|---|---|---|---|
| s3x | 14.6 | 0.16s / — | 7.4 | 0.11s / 6.7s | 7.4 | 0.11s / 6.7s |
| s3 | 1.8 | 1.00s / — | 1.8 | 1.01s / 20.2s | 1.8 | 0.99s / 20.0s |
| azurex | 2.4 | 1.12s / — | 1.8 | 0.89s / 21.7s | 1.8 | 0.87s / 21.2s |
| azure | 1.8 | 1.50s / — | 1.5 | 1.26s / 22.6s | 1.5 | 1.25s / 23.8s |
| gcp | 0.4 | 4.56s / — | 0.4 | 4.60s / 32.9s | 0.4 | 4.62s / 30.1s |
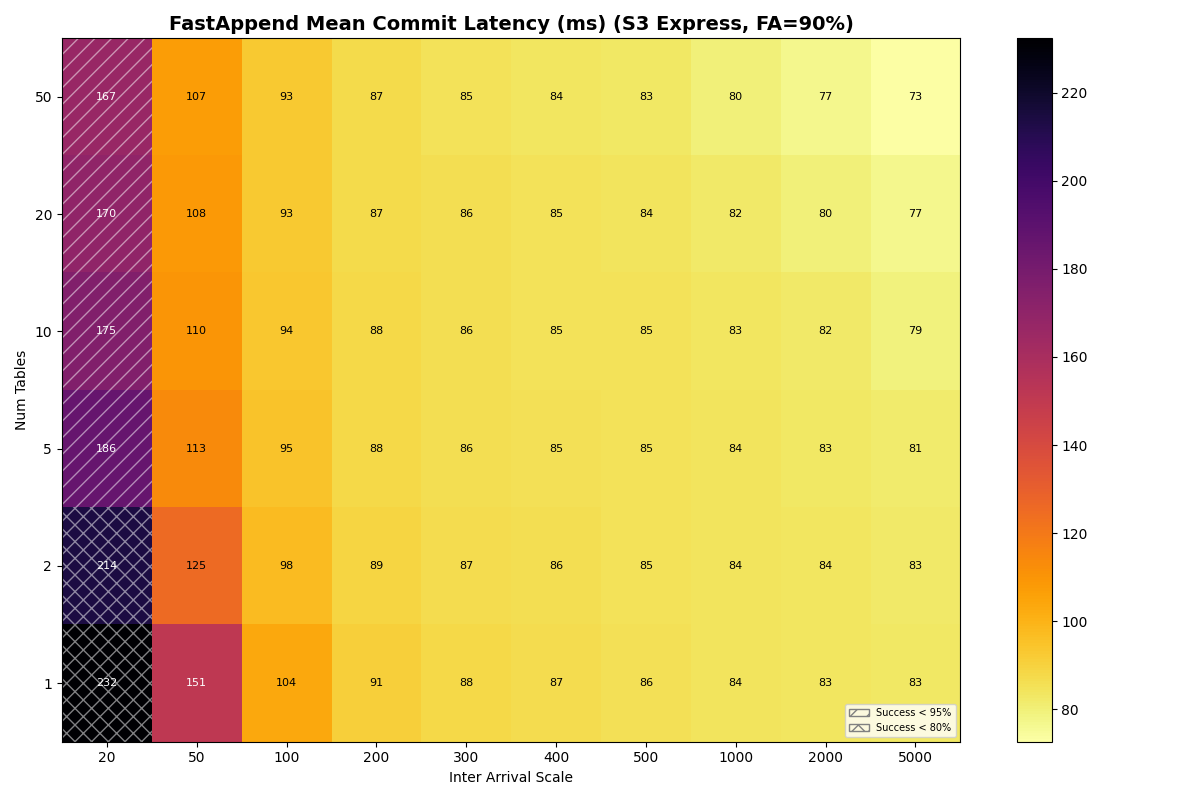
In the commit path, I/O latency for metadata is the dominant factor across providers. S3 Express One Zone is in its own class on this workload, delivering 3-6x the throughput of the next tier (S3 Standard, Azure Premium, Azure Standard) and up to 20x the throughput of GCS. Its low latency and low variance for both reads and writes compress the entire commit pipeline.
To accommodate 10% VO transactions, even S3x requires a 2x reduction in throughput to keep success rates above 95%.
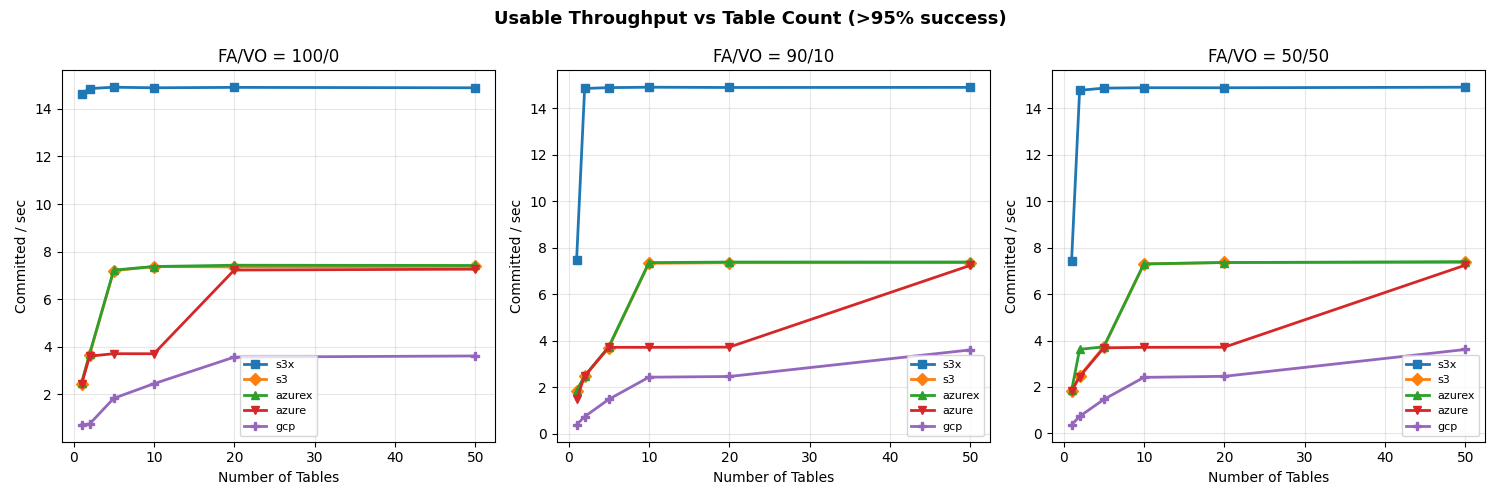
Multiple tables
With uniform table selection, partitioned workloads fall into three performance tiers:
s3x (14.9 c/s at 10 tables, up to 36 c/s at 20+ tables) » s3 / azurex / azure (3.7 c/s) » gcp (0.7 c/s simulated, ~0.7 actual)
For S3, Azure Premium, and Azure Standard the usable rate plateaus at 3.7 c/s from 5 tables through 20 tables. The per-table ceiling at S3 median latencies is ~5.7 c/s (five serial S3 ops per attempt), so the aggregate knee lines up with the catalog-CAS rate taking over only when per-table offered load drops far enough. That happens at 50 tables for S3 Standard FA-only, where the knee jumps to 7.2 c/s — but adding even 10% VO pulls it back down to 3.7 c/s. Azure Premium and Azure Standard stay at 3.7 c/s all the way through 50 tables.
This tier is narrower than it looks. Adding tables beyond ~5 buys little for S3/Azure on mixed workloads: the per-table metadata pipeline is the binding constraint, not the catalog round-trip.
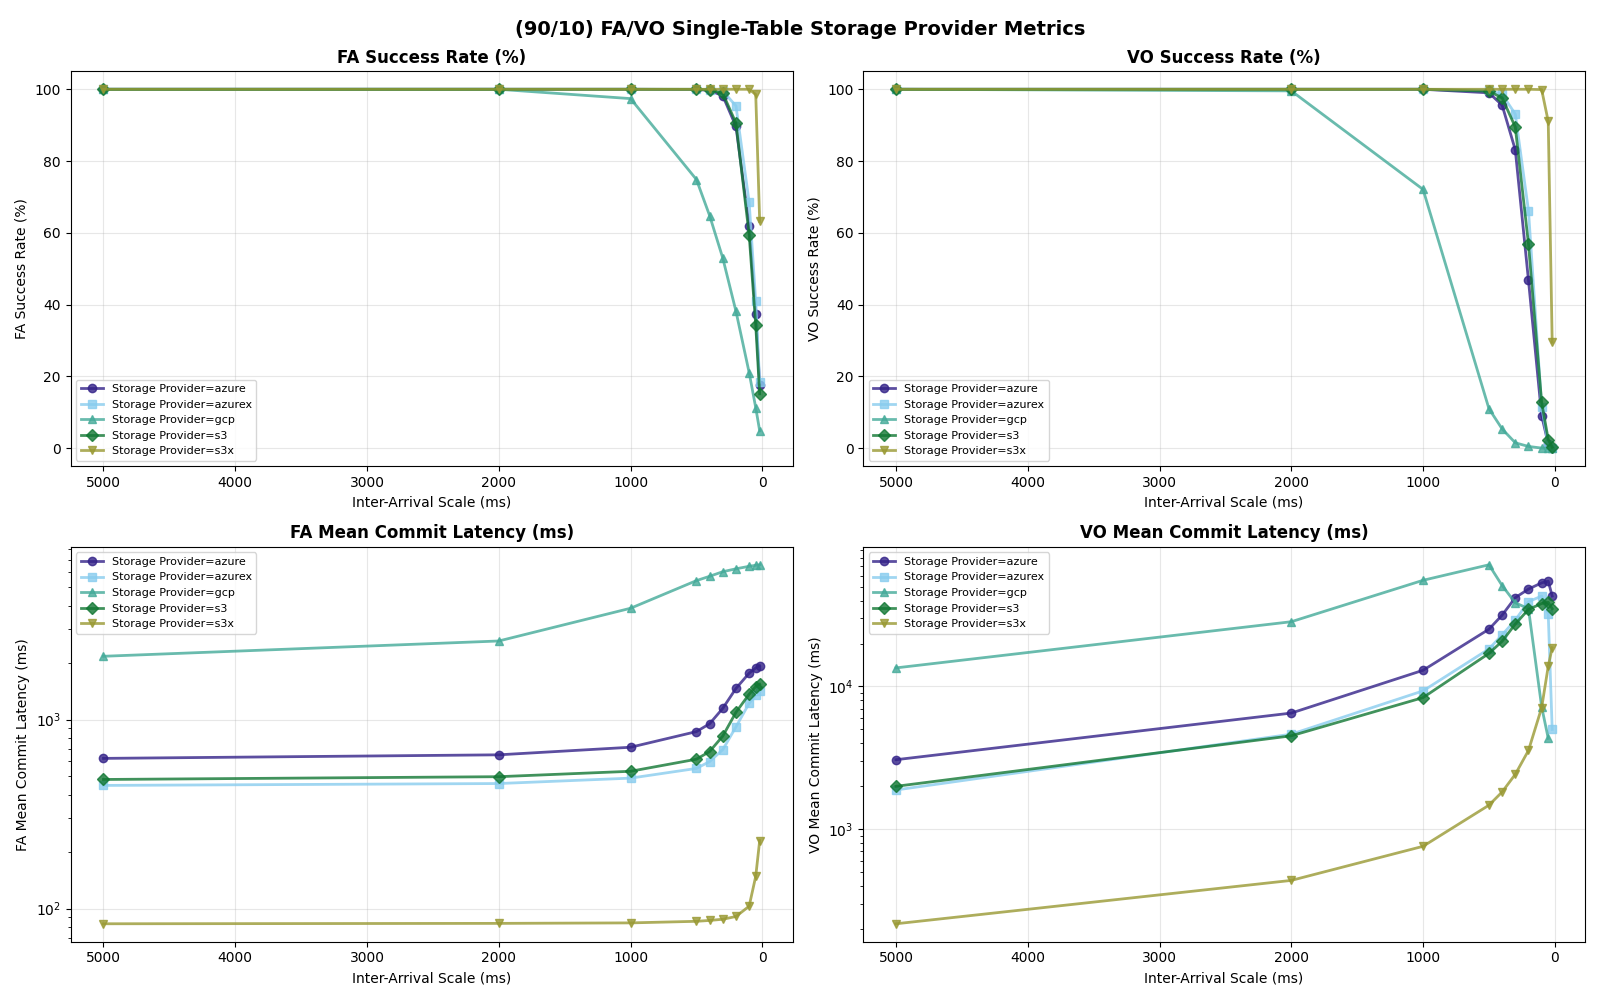
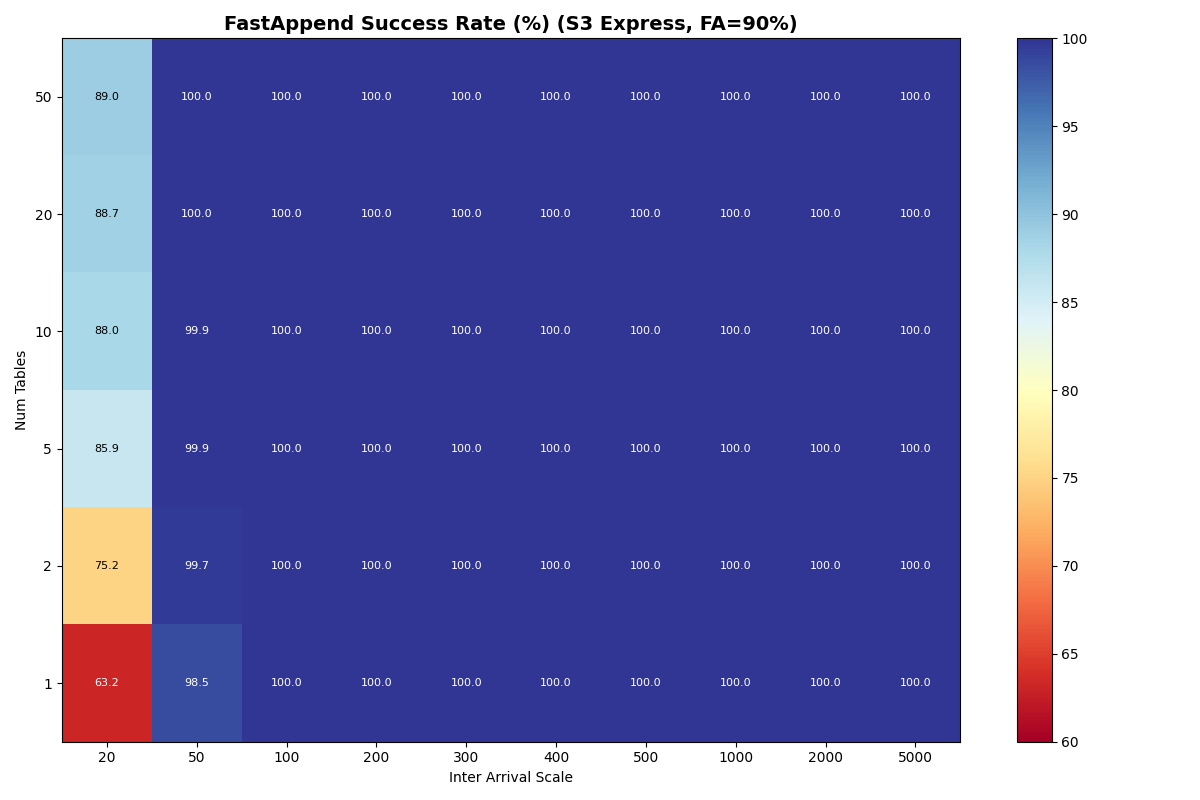
Outliers: S3 Express One Zone (S3x) and GCP
S3x benefits from partitioning immediately and keeps benefiting. Its single-table knee is 14.6 c/s FA-only (7.4 c/s mixed); with 2+ tables mixed workloads also sustain 14.9 c/s. Beyond 20 tables FA-only, cross-table CAS contention still dominates but each failure costs only a re-CAS (manifest I/O is skipped for disjoint-table conflicts), so the usable FA-only rate jumps to ~36 c/s at 20–50 tables.
The simulated GCP rate is 0.7 c/s at 50 tables, up from 0.4 c/s at 1 table — a much weaker curve than the other providers. GCS’s per-op latency is high enough (~200 ms GET/PUT, ~170 ms CAS median) that each attempt costs roughly 590 ms even with a fast catalog, so per-table throughput caps at ~1.7 c/s and the catalog CAS caps the aggregate at ~8.5 c/s. The real product is much lower: GCS measured CAS throughput saturates at 0.8–1.4 op/s before any commit-protocol overhead.
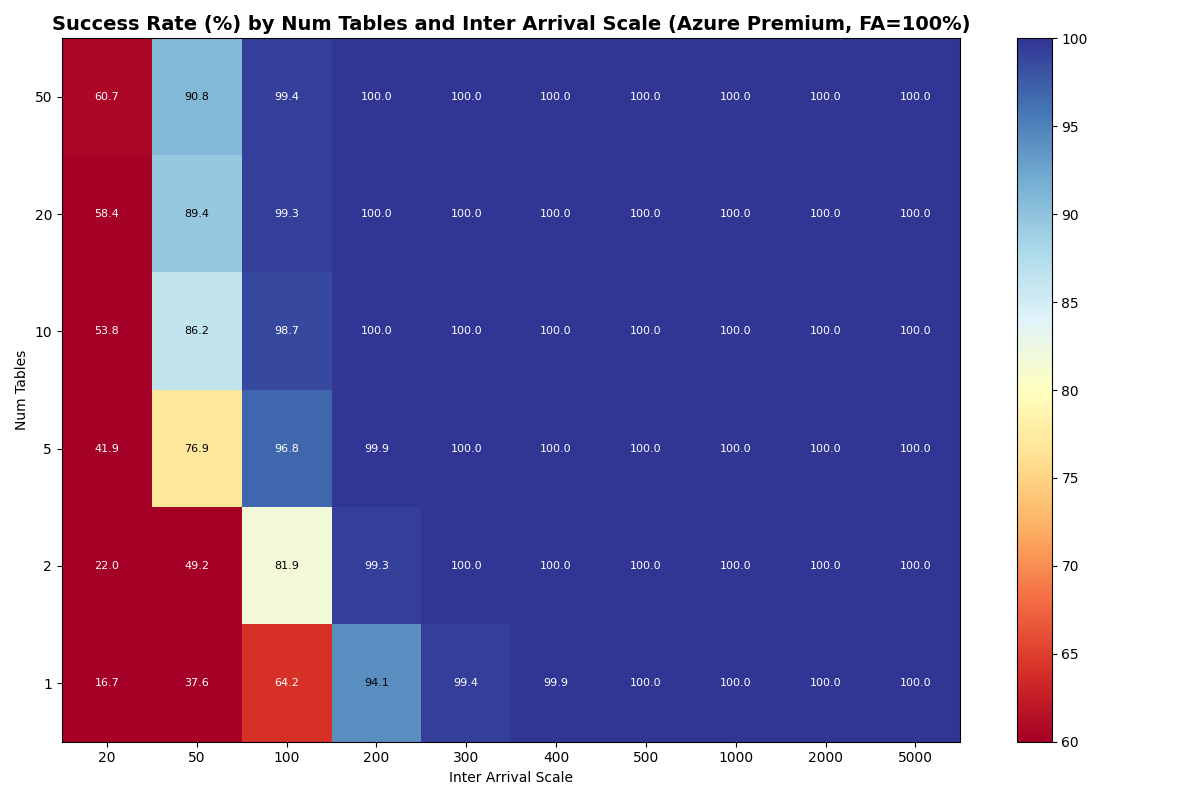
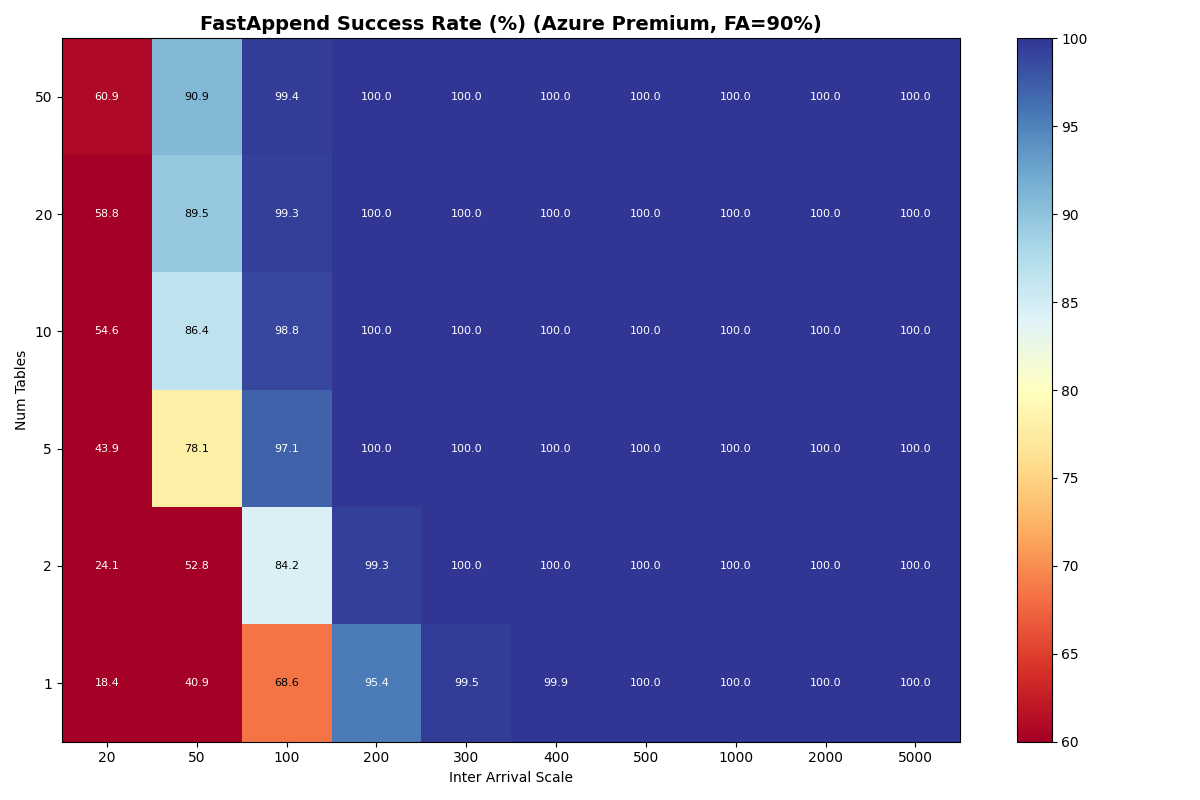
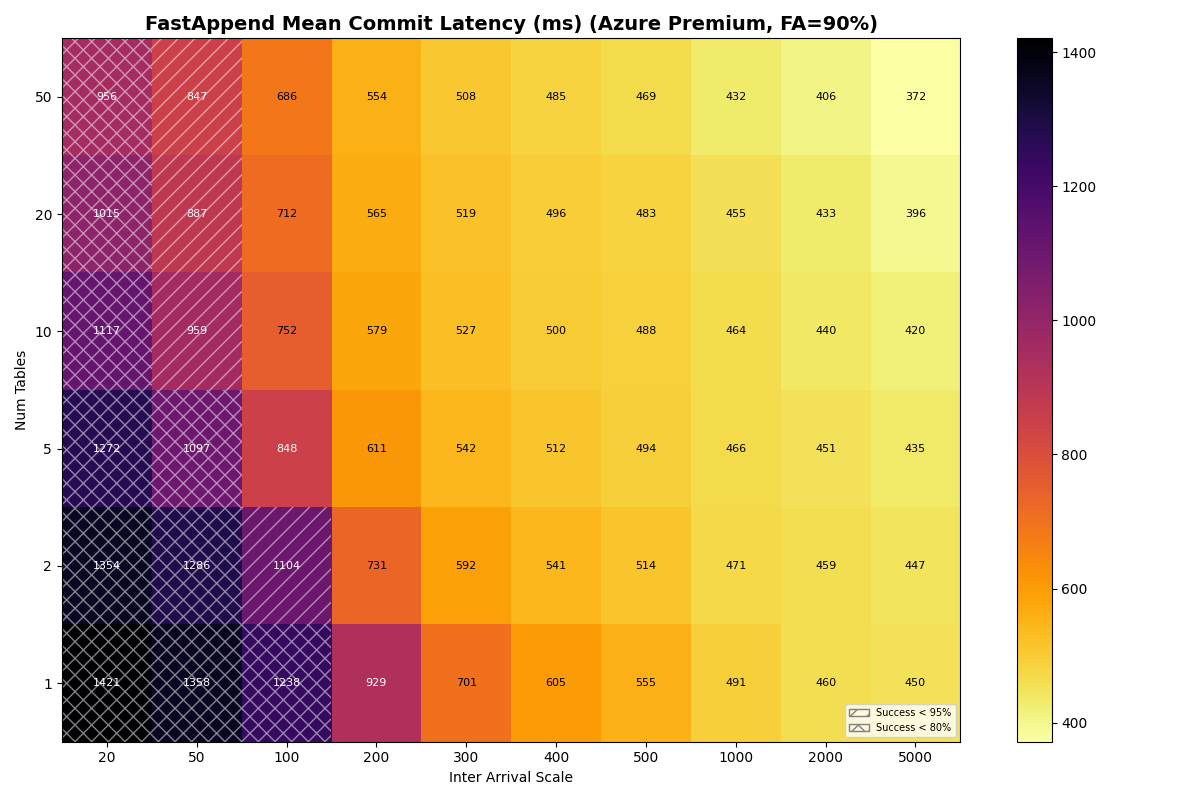
Main tier: S3 Standard, Azure Premium, Azure Standard
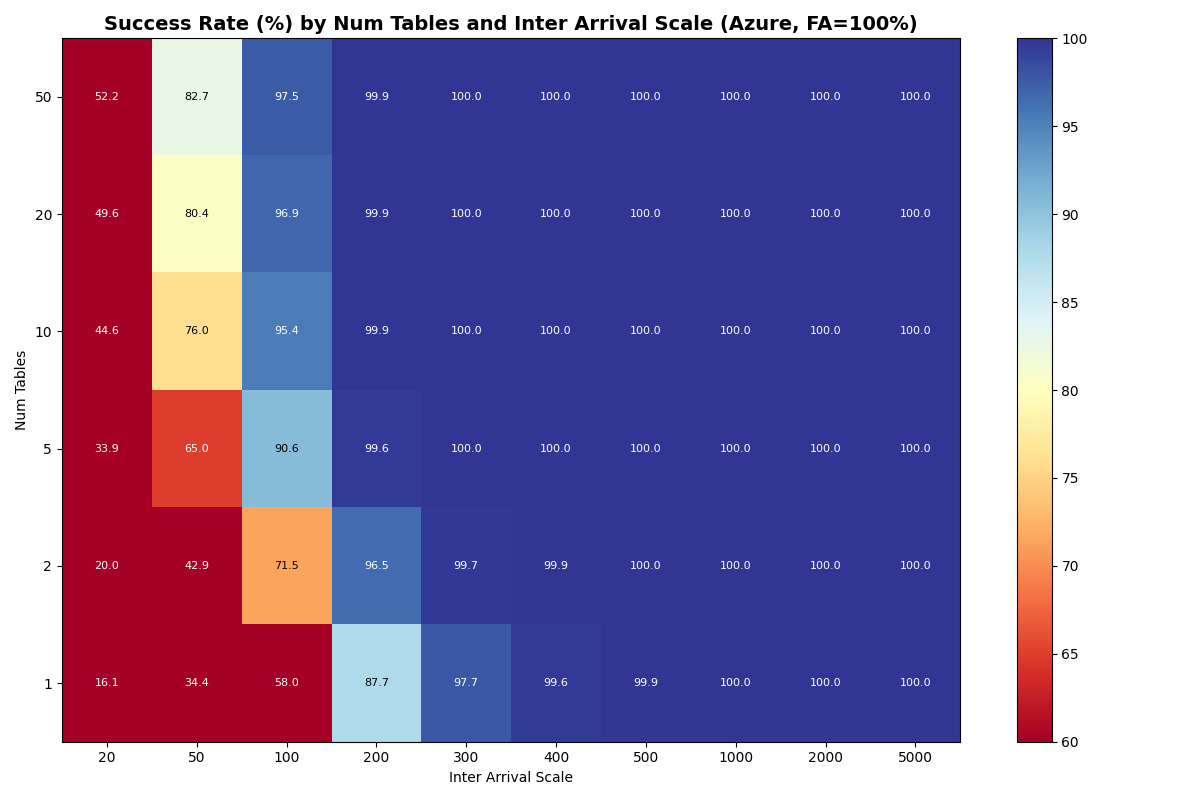
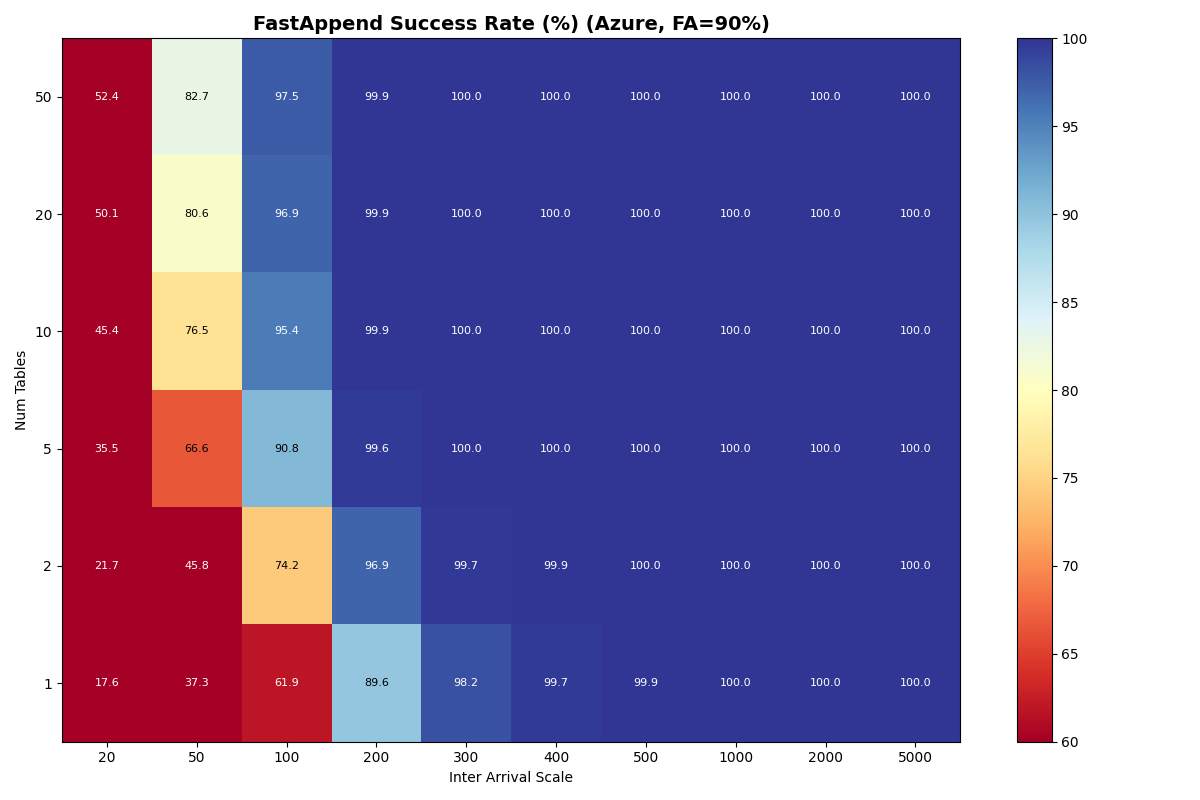
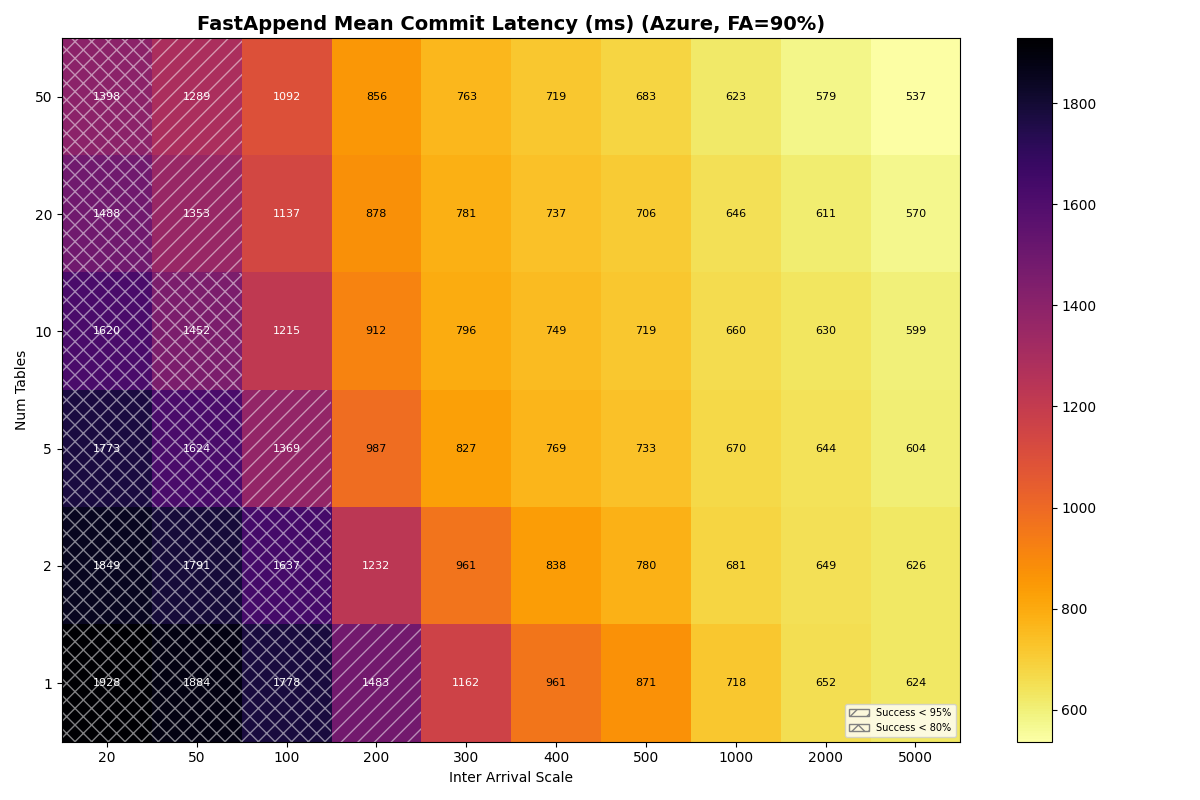
The other three stores are more interesting. S3 and Azure Premium have similar CAS medians (61 vs 64ms), but Azure Premium’s CAS sigma is 5x larger (0.73 vs 0.14). Azure is worse on both axes: higher median (93ms) and higher sigma (0.82).
| Provider | CAS median | CAS σ | Read σ | Write σ |
|---|---|---|---|---|
| S3 | 61ms | 0.14 | 0.62 | 0.29 |
| Azure Premium | 64ms | 0.73 | 0.08 | 0.10 |
| Azure | 93ms | 0.82 | 0.66 | 0.50 |
In this model, both Azure Premium and Standard have higher CAS variance, but Premium has very tight read/write variance; its I/O is predictable even if the CAS is noisy. At 10 tables all three stores land at the same 3.7 c/s knee — they are all bound by the per-table metadata pipeline, not the catalog CAS. Azure Standard’s wider I/O variance shows up in mean latency (1.33s vs S3/Azure Premium’s 0.82s) and VO mean latency (6.8s vs 4.7s).
| Provider | 100/0 (c/s) | 100/0 (FA/VO lat) | 90/10 (c/s) | 90/10 (FA/VO lat) | 50/50 (c/s) | 50/50 (FA/VO lat) |
|---|---|---|---|---|---|---|
| s3x | 14.9 | 0.11s / — | 14.9 | 0.12s / 1.4s | 14.9 | 0.11s / 1.4s |
| s3 | 3.7 | 0.82s / — | 3.8 | 0.82s / 4.7s | 3.7 | 0.82s / 4.6s |
| azurex | 3.7 | 0.82s / — | 3.7 | 0.82s / 4.8s | 3.7 | 0.81s / 4.8s |
| azure | 3.7 | 1.33s / — | 3.7 | 1.33s / 6.8s | 3.7 | 1.32s / 6.8s |
| gcp | 0.7 | 3.99s / — | 0.7 | 4.01s / 8.6s | 0.7 | 3.99s / 8.8s |
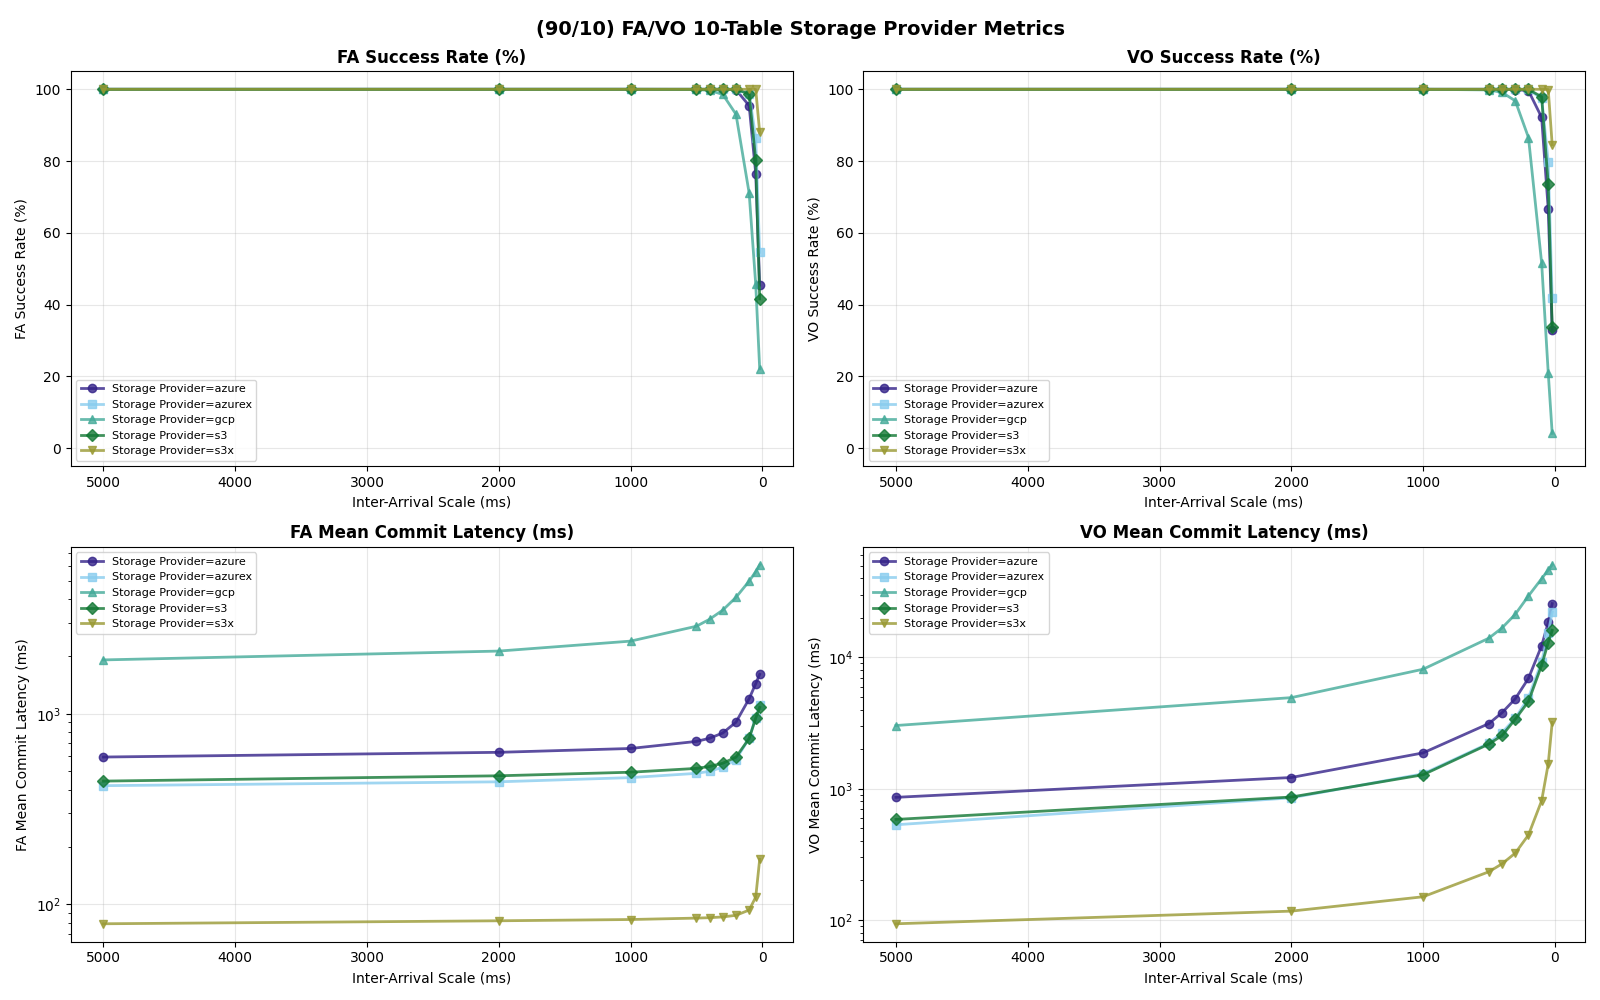
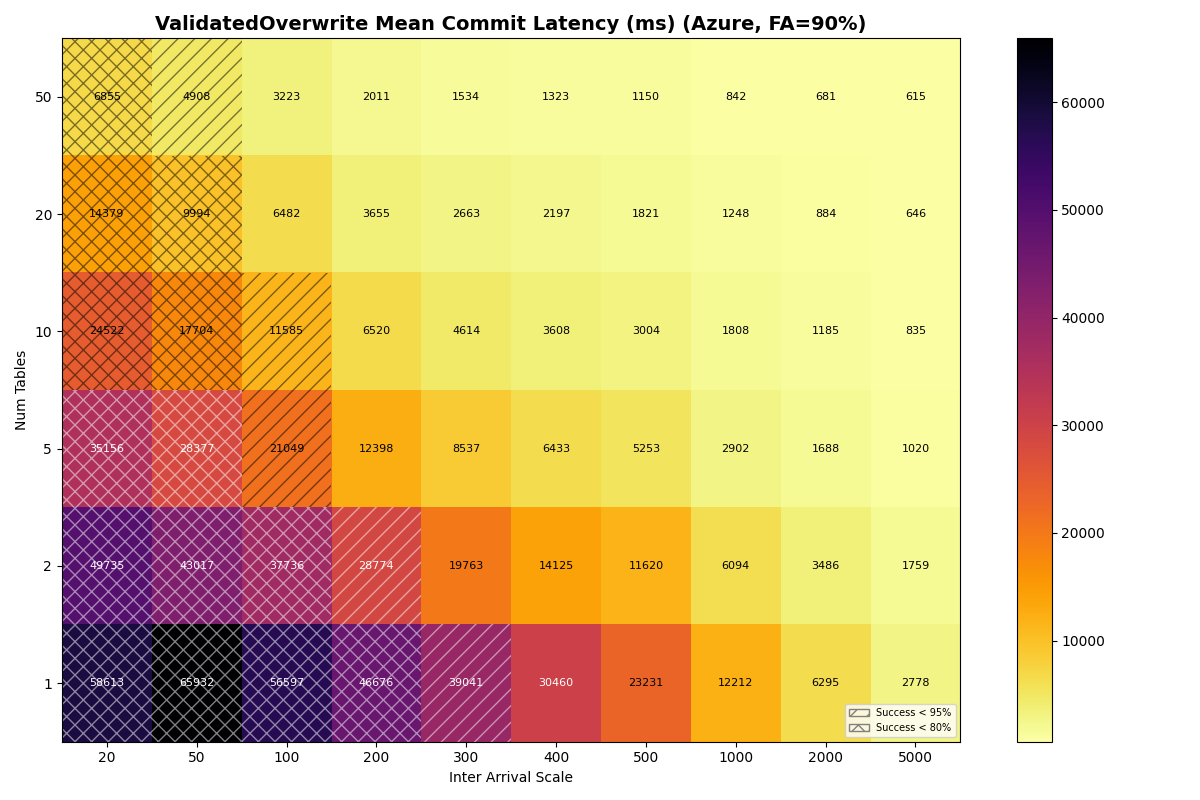
Put another way: when Azure Standard retries take 5-10x the median, they’re almost certainly waste. In settings with high variance, commit protocols need to minimize how often a retry attempt samples from a fat-tailed distribution. Azure Standard’s higher variance shows up in FA mean latency (~1.33s vs S3/Azure Premium ~0.82s) and in VO mean latency rather than in the sustainable rate, which lands on the per-table bound at 3.7 c/s just like S3 and Azure Premium.
Takeaway: S3x is in a different class for catalog-as-file workloads. Distributing load across tables is effective, but store variance can drive failure rates up even at low arrival rates.
Conclusion
We tested two levers for improving commit throughput under contention: adding tables and choosing a faster storage provider. Both help, but the gap between them widened with the corrected per-attempt I/O cost.
Provider choice matters more than table count. S3 Express sustains 14.6 c/s (FA-only) on a single table — more per-table throughput than spreading the same load across 20 tables on S3 Standard (3.7 c/s aggregate, ~0.18 c/s per table). Fast storage compresses the entire commit pipeline (CAS + manifest I/O), while adding tables only relieves catalog contention. For providers in the 1–2 c/s single-table tier (S3, Azure Premium, Azure Standard), 5+ tables yield ~2x aggregate scaling to 3.7 c/s and stall there; only at 50 tables does S3 Standard’s FA-only knee climb to 7.2 c/s.
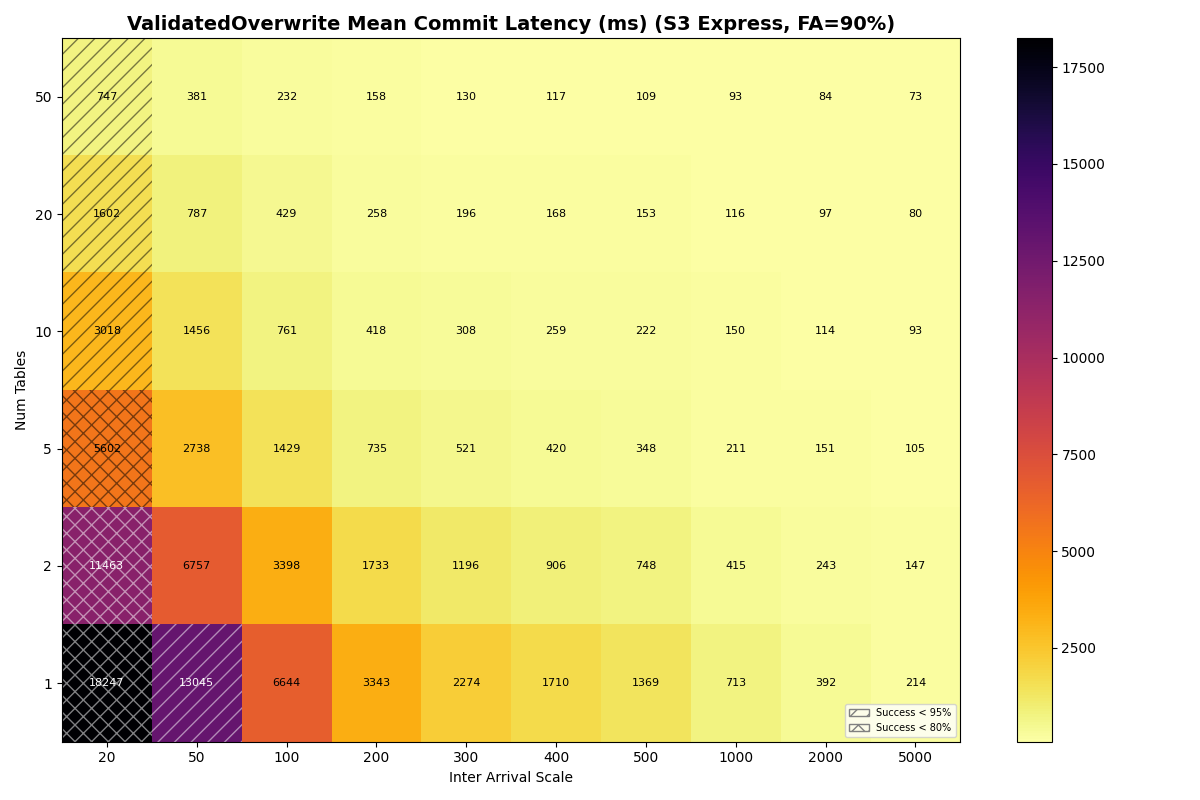
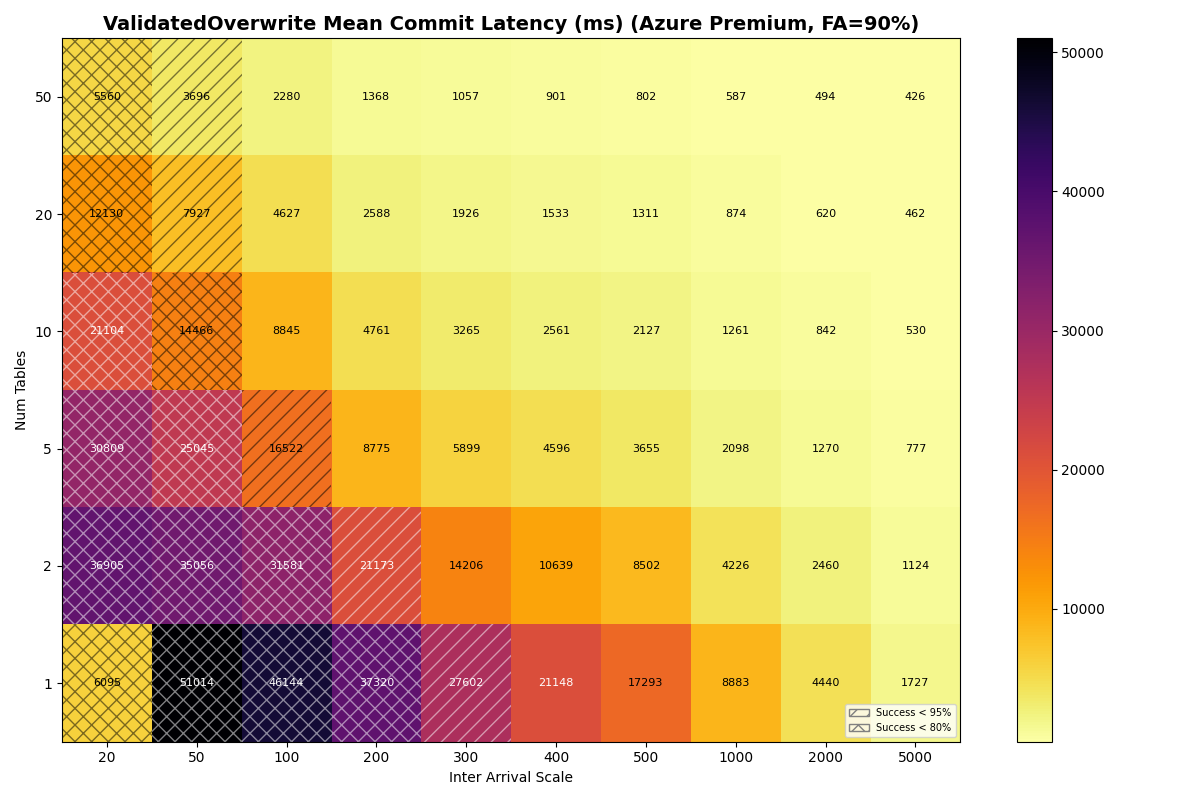
Table partitioning reduces VO retry cost. Each VO retry reads manifest lists proportional to snapshots committed to that table since the read snapshot. With more tables, each table sees fewer commits, and VO tail latency drops accordingly. For S3 Standard 90/10 mix, VO mean latency falls from 20.2s at 1 table to 4.7s at 10 tables and 2.6s at 20 tables. S3 Express drops from 6.7s to 0.8s over the same range. Under Zipfian skew, the hot table still converges to single-table performance, but catalog contention does not impact the less popular tables.
The protocol still matters at single-table scale. On a single table, VO mean latency reaches tens of seconds at moderate throughput regardless of provider (S3: 20.2s, Azure Premium: 21.7s, Azure Standard: 22.6s, GCP: 32.9s). S3 Express’s 6.7s single-table VO mean is the lowest of any provider, though still impractical for most production workloads.
Take the simulated provider experiments with a grain of salt: the labels we’re putting on the storage distributions are drawn from measurements of real systems, but these parameters do not completely describe reality. These are optimistic models of provider performance. It is unlikely that real workloads could sustain these rates without external coordination.
One practical takeaway: catalog and table conflicts should be handled separately by the retry policy. Catalog conflicts are cheap to retry (re-read the catalog, re-apply the CAS) while table conflicts require re-reading manifest lists. Immediate retry for catalog conflicts and exponential backoff for table conflicts would better match the cost structure.
More broadly, these simulations may be sufficient to indict the commit protocol. Writing copy-on-write objects to storage on every commit attempt is a self-imposed obstacle to scaling commit throughput, more than writing to the same catalog object in every commit.
Correction 2026-06-09
The numbers in this post were regenerated on 2026-04-17 after finding some simulator bugs, listed below. The qualitative conclusions survive- the tier ordering and the “partitioning helps” story are intact- but the multi-table knees moved substantially, in both directions: the 5-20 table knee for S3/Azure drops by half, GCP scaling is much weaker than presented, and S3x at 20+ tables jumps to roughly 2.5x the published rate.
- Per-attempt I/O cost corrected. Each commit attempt now issues five S3 round-trips (
TM_read + ML_read + ML_write + TM_write + CAS) instead of three. The per-table ceiling at S3 medians tightens from ~7.7 c/s to 5.7 c/s. For S3/Azure at 5–20 tables the knee drops from ~7.4 to 3.7 c/s: the per-table bound bites before the catalog CAS does. Only at 50 tables does catalog CAS again become the bottleneck (for S3 FA-only). - Cross-table CAS free retry. Multi-table CAS failures caused by commits on different tables no longer charge manifest I/O, and only charge for the CAS conflict. This is why S3 Express at 20+ tables FA-only jumps from 14.9 to ~36 c/s: its CAS throughput was already the binding constraint, and removing the spurious manifest I/O lets more commits through.
- Timing leaks removed. The CAS version check and
catalog.read()both split-yield at half-RTT, eliminating a fast path where clients could commit against state propagating faster than the full CAS round trip. - VO convoy decomposed per-table. The IO convoy was using a global value and ignored the per-table configuration. Corrected, multi-table VO tails are lower.
- GCP scaling is weaker than presented. With the tighter per-table bound, 50 tables only reach 0.7 c/s for GCP (was 3.6 c/s in the old model).
table_metadata_inlinedconfig drift fixed. An orphaned template flag had silently switched intermediate re-runs to the 1/(3L) inlined bound; the post now uses non-inlined metadata, matching the original intent.
The tier ordering (S3x » S3/Azure Premium/Azure Standard » GCP) is unchanged, which makes sense given the measured CAS latencies. Adding tables improves scalability, but less than the original numbers implied, especially at 5–20 tables.
One presentational change: VO latency figures in this post are now reported as the mean, where the previous version cited VO P99. With the per-table convoy fix, the mean is a more stable summary of the distribution.
Full correction details (AI generated)
Single-table knees at >95% VO success:
| Provider | Published FA-only | Corrected FA-only | Published 90/10 | Corrected 90/10 |
|---|---|---|---|---|
| S3 Express | 14.6 c/s | 14.6 c/s | 7.5 c/s | 7.4 c/s |
| S3 Standard | 2.4 c/s | 1.8 c/s | 1.8 c/s | 1.8 c/s |
| Azure Premium | 2.5 c/s | 2.4 c/s | 1.9 c/s | 1.8 c/s |
| Azure Standard | 2.4 c/s | 1.8 c/s | 1.5 c/s | 1.5 c/s |
| GCP | 0.7 c/s | 0.4 c/s | 0.4 c/s | 0.4 c/s |
The biggest structural change is the multi-table FA-only knee for S3 Standard and Azure Premium at 5–20 tables:
| Provider | Tables | Published | Corrected | Δ |
|---|---|---|---|---|
| S3 Standard | 5–20 | 7.2–7.4 c/s | 3.7 c/s | −50% |
| S3 Standard | 50 | 7.4 c/s | 7.2 c/s | −3% |
| Azure Premium | 5–20 | 7.2–7.4 c/s | 3.7 c/s | −50% |
| Azure Premium | 50 | 7.4 c/s | 3.7 c/s | −50% |
| Azure Standard | 10–50 | 3.7 c/s | 3.7 c/s | — |
| GCP | 50 | 3.6 c/s | 0.7 c/s | −81% |
| S3 Express | 50 | 14.9 c/s | 36.0 c/s | +142% (free-retry for cross-table CAS failures) |
For S3/Azure at 5–20 tables the published numbers were catalog-CAS-bound at ~7.4 c/s; with the non-inlined per-table ceiling now at 5.7 c/s, the per-table bound binds first and the knee flattens to 3.7 c/s. Only at 50 tables does catalog CAS again become the bottleneck (for S3 Standard FA-only; Azure Premium sits at the per-table bound through 50 tables).
S3 Express at 50 tables jumps to 36 c/s because its ~10 ms per-op latency keeps the per-table bound very high; with the ec383ff free-retry fix, cross-table CAS failures no longer charge manifest I/O, so the catalog handles more commits.
GCP’s multi-table scaling is weaker than presented: 0.4 c/s (1 table) to 0.7 c/s (50 tables) FA-only, versus the published 0.7 c/s to 3.6 c/s. The per-op latency is high enough that the per-table bound binds through 50 tables.
Appendix A: Full 4a/4b results
Full heatmaps for experiments 4a (FA-only) and 4b (90/10 FA/VO mix) across table counts, inter-arrival times, and catalog CAS latencies. Both uniform and Zipfian table selection distributions are included.
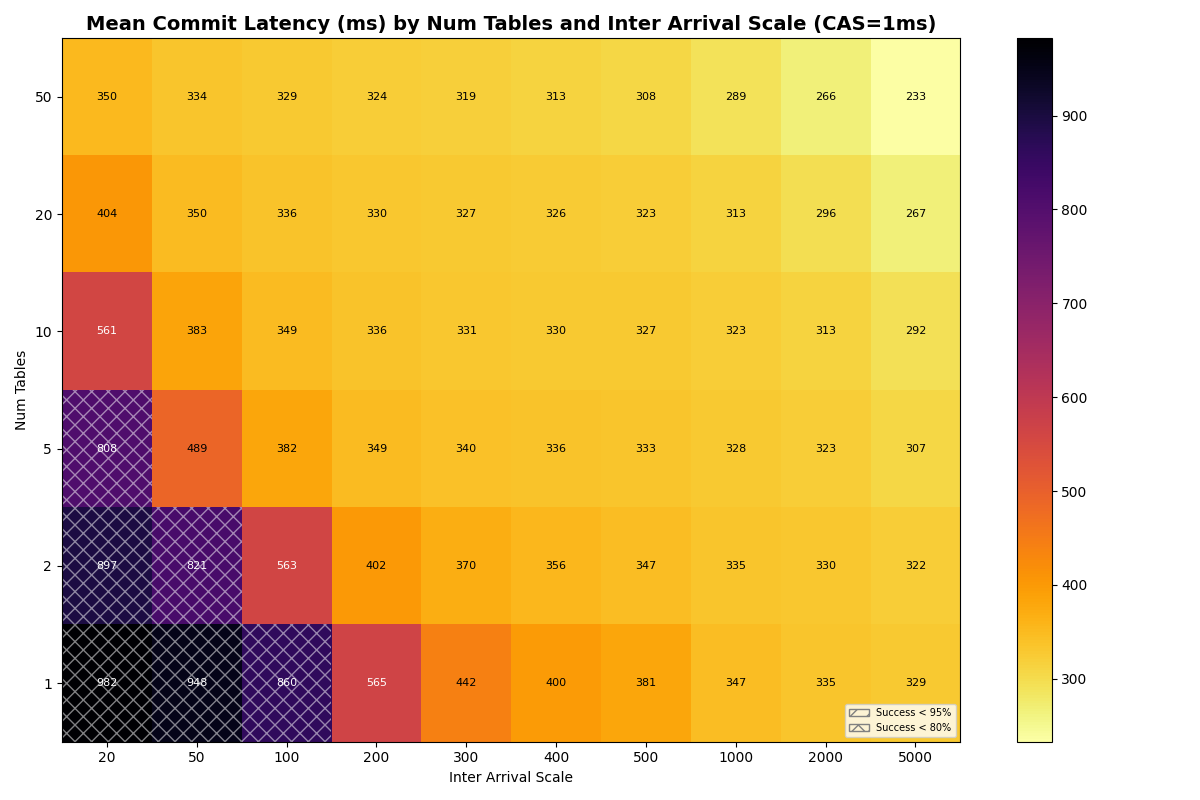
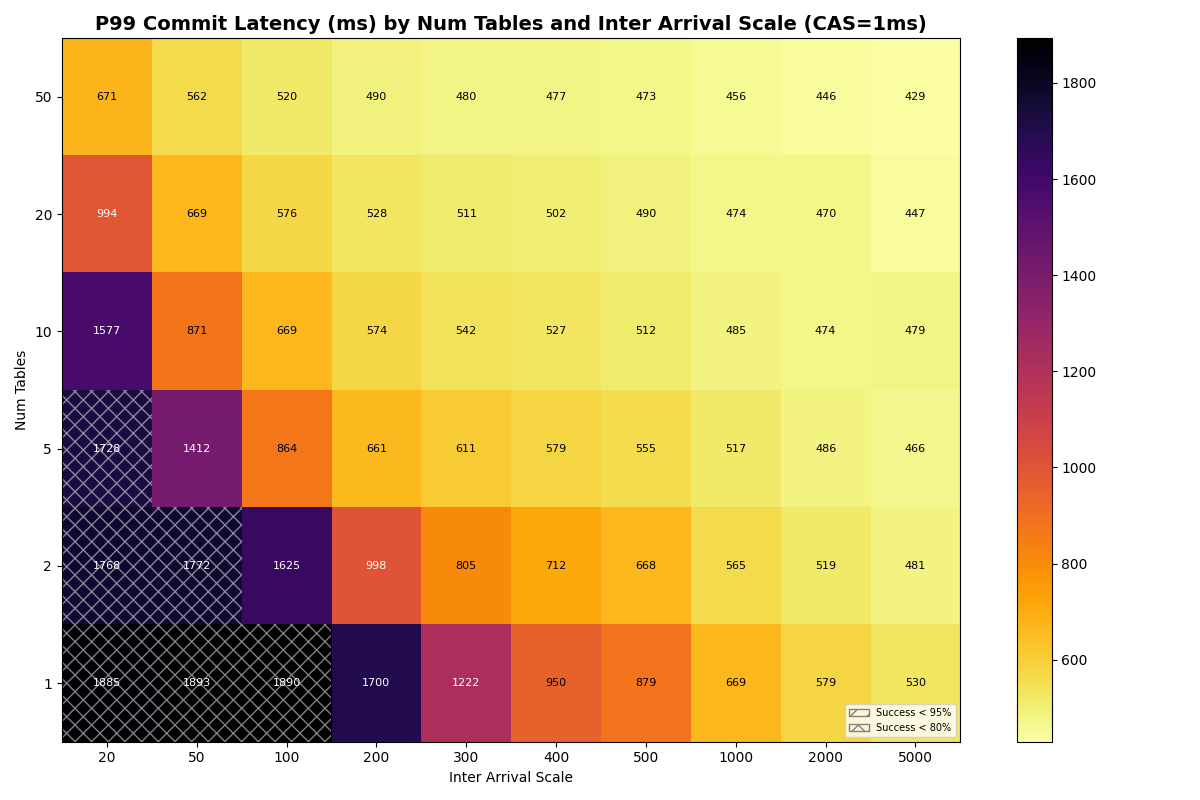
4a: FA-only, uniform (10ms, 1ms CAS)
4a: FA-only, uniform (50ms, 120ms CAS)
4a: FA-only, Zipfian (50ms CAS)
4b: 90/10 FA/VO mix, uniform (10ms, 1ms CAS)
4b: 90/10 FA/VO mix, uniform (50ms, 120ms CAS)
4b: 90/10 FA/VO mix, Zipfian (50ms CAS)
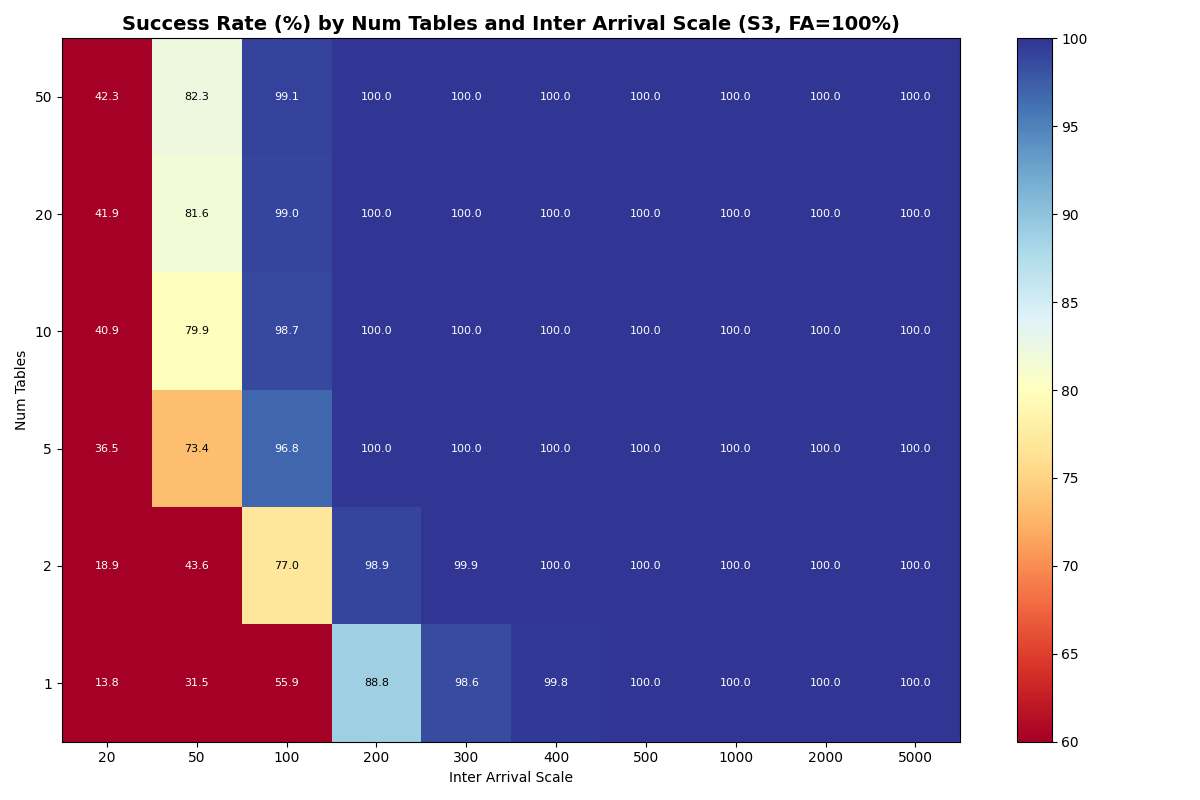
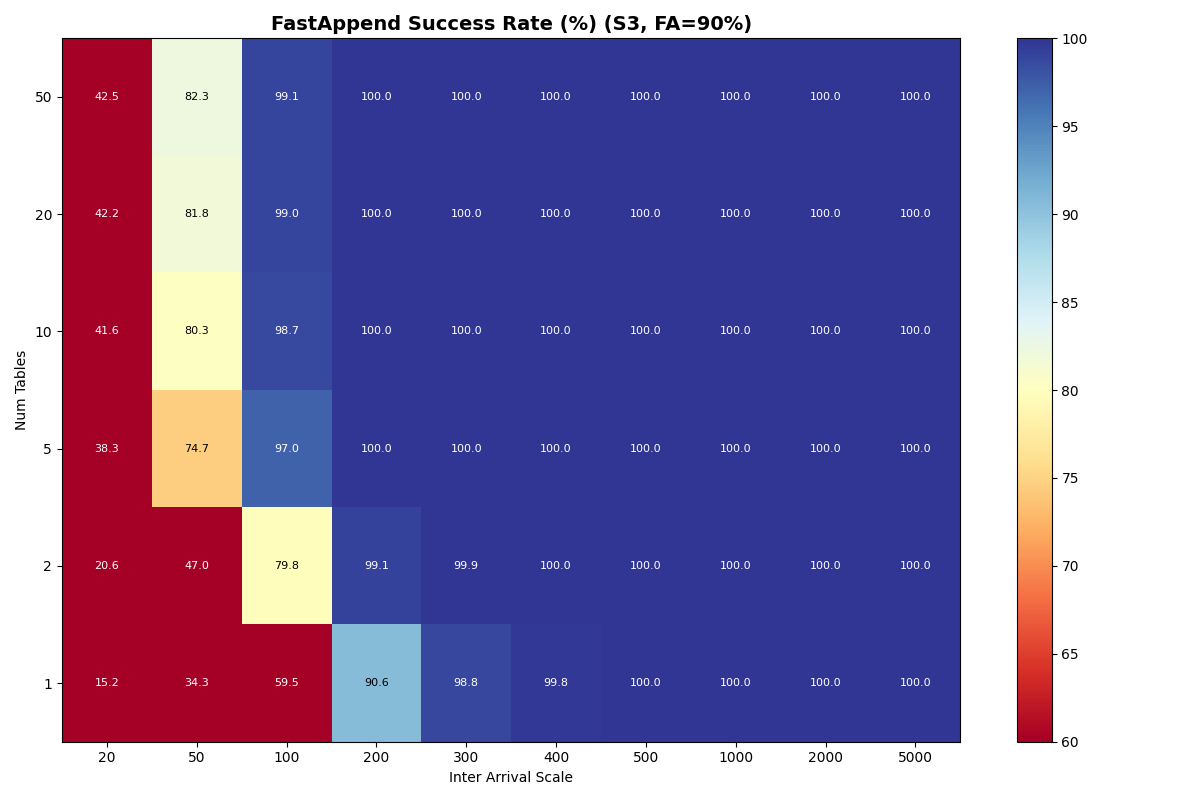
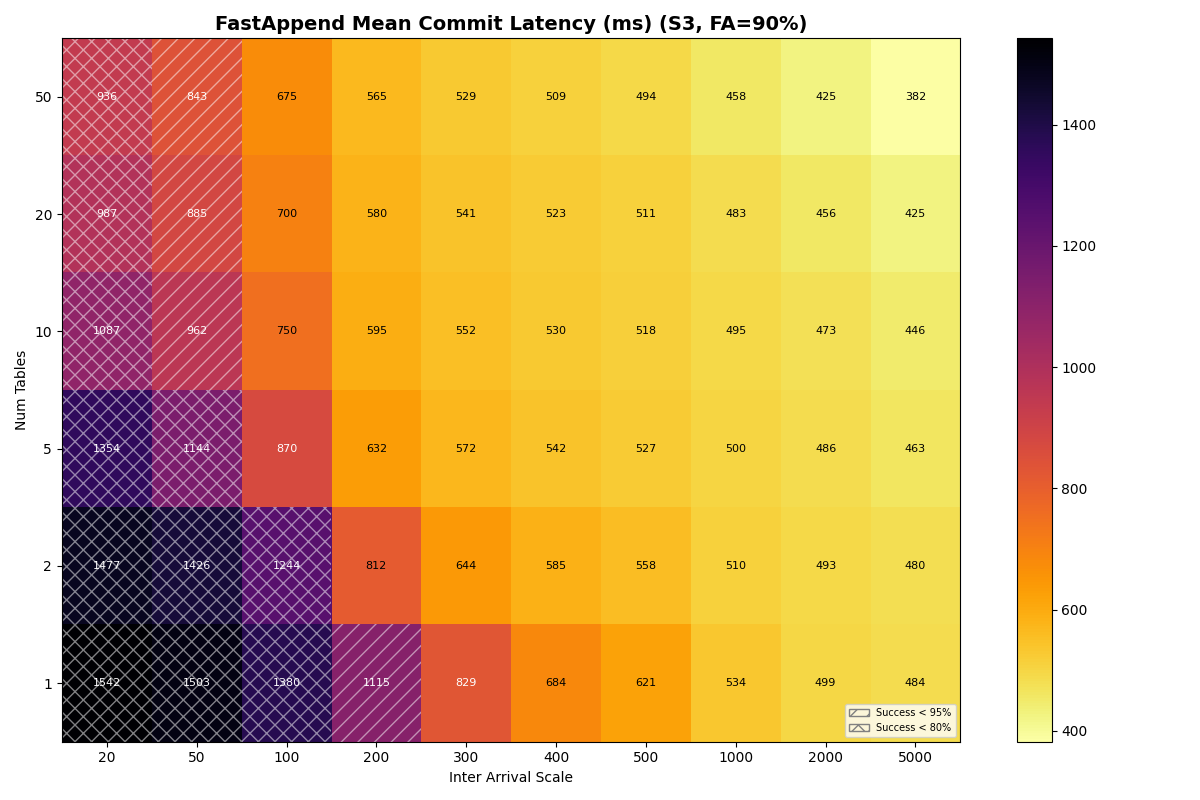
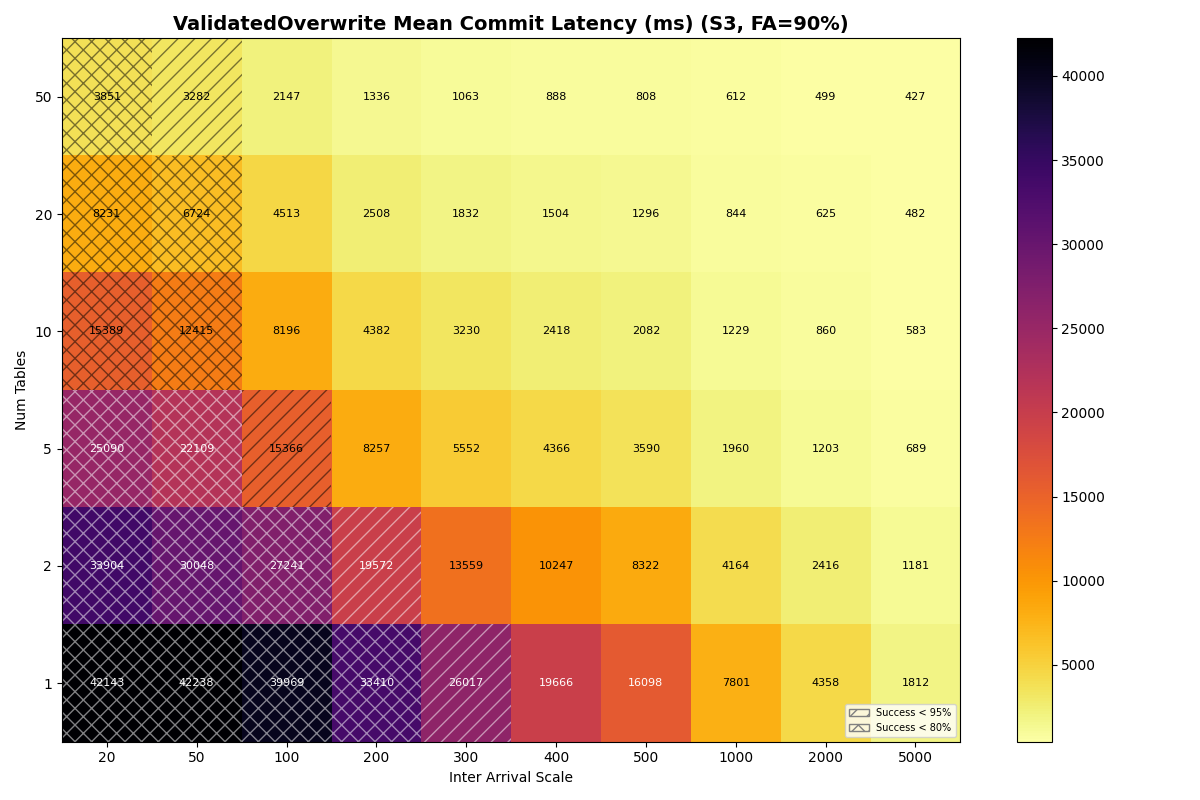
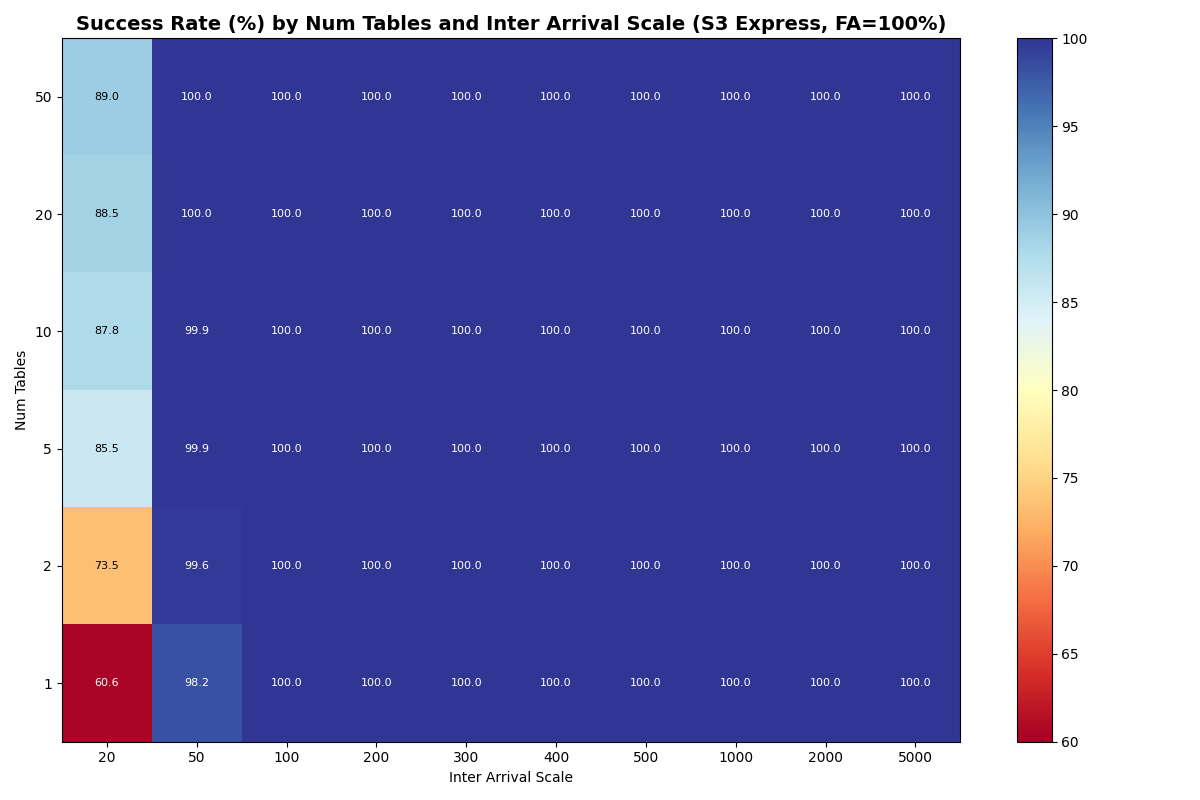
Appendix B: Full 4c results
Galleries of success rate and latency heatmaps for all 5 storage providers, across all table counts, inter-arrival times, and workload mixes. Click on an image to view the gallery and flip through them.
S3
S3 Express One Zone
Azure Standard
Azure Premium
Google Cloud Storage (GCS)